Viewing Project Data
Viewing Project data
After you have finished ingesting your Project data it can be viewed in the C4S App using the tabs across the top of the page. Before navigating to the C4S Analysis functionality, the user can firstly check the Site and Spectra information uploaded, with examples given below.
C4S tabs of Optimal Lab Sampling, Spectral Selection Requests and Predictions are detailed in their own page under the C4S App documentation.
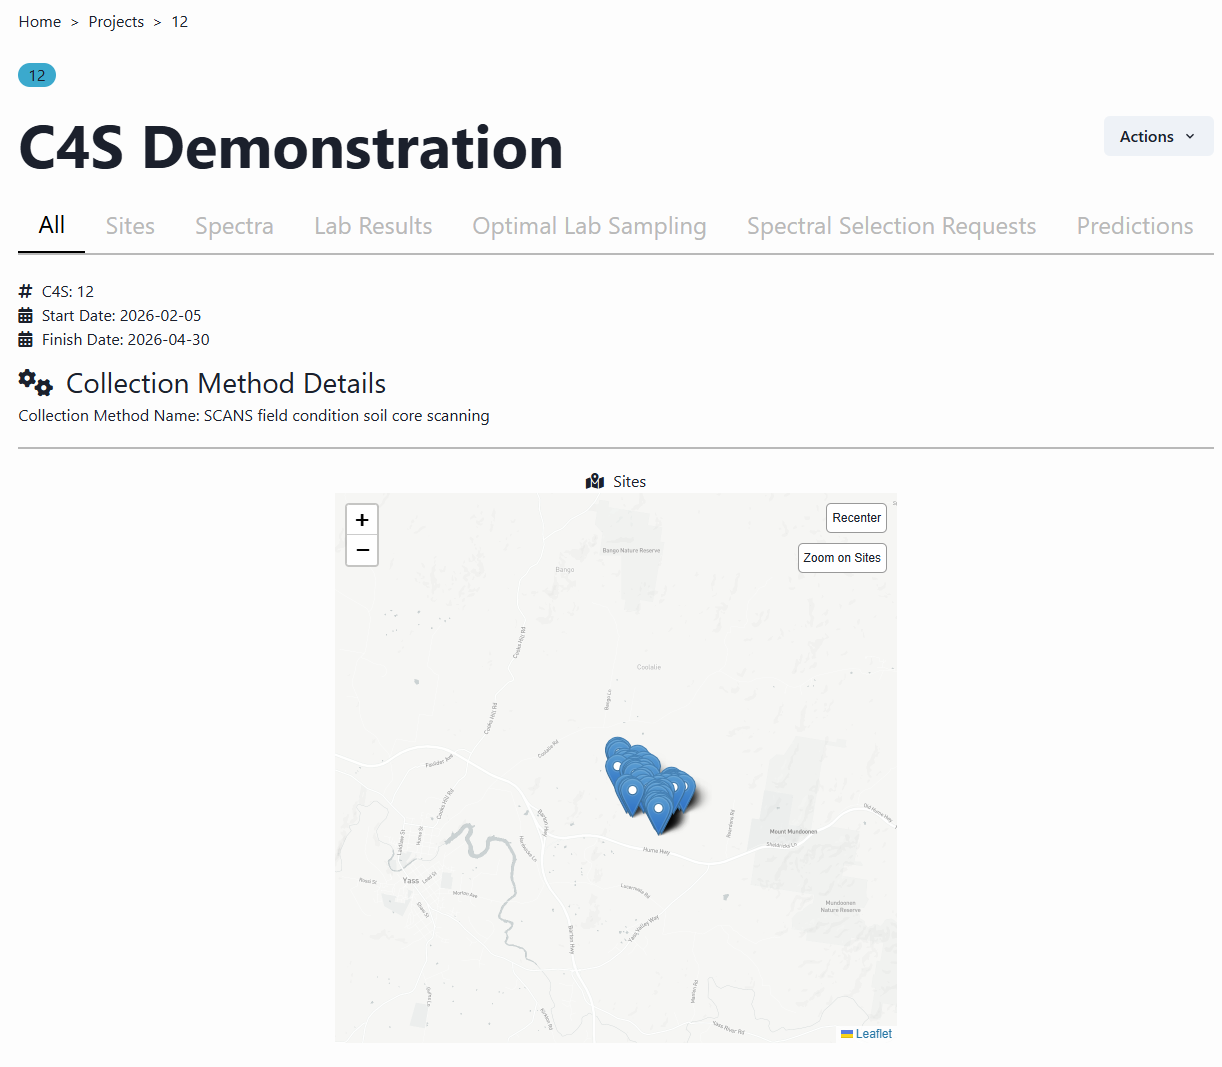
The first page under All shows the user the location of the uploaded dataset. This is a good way of checking that site geolocation information has been provided in the correct format.
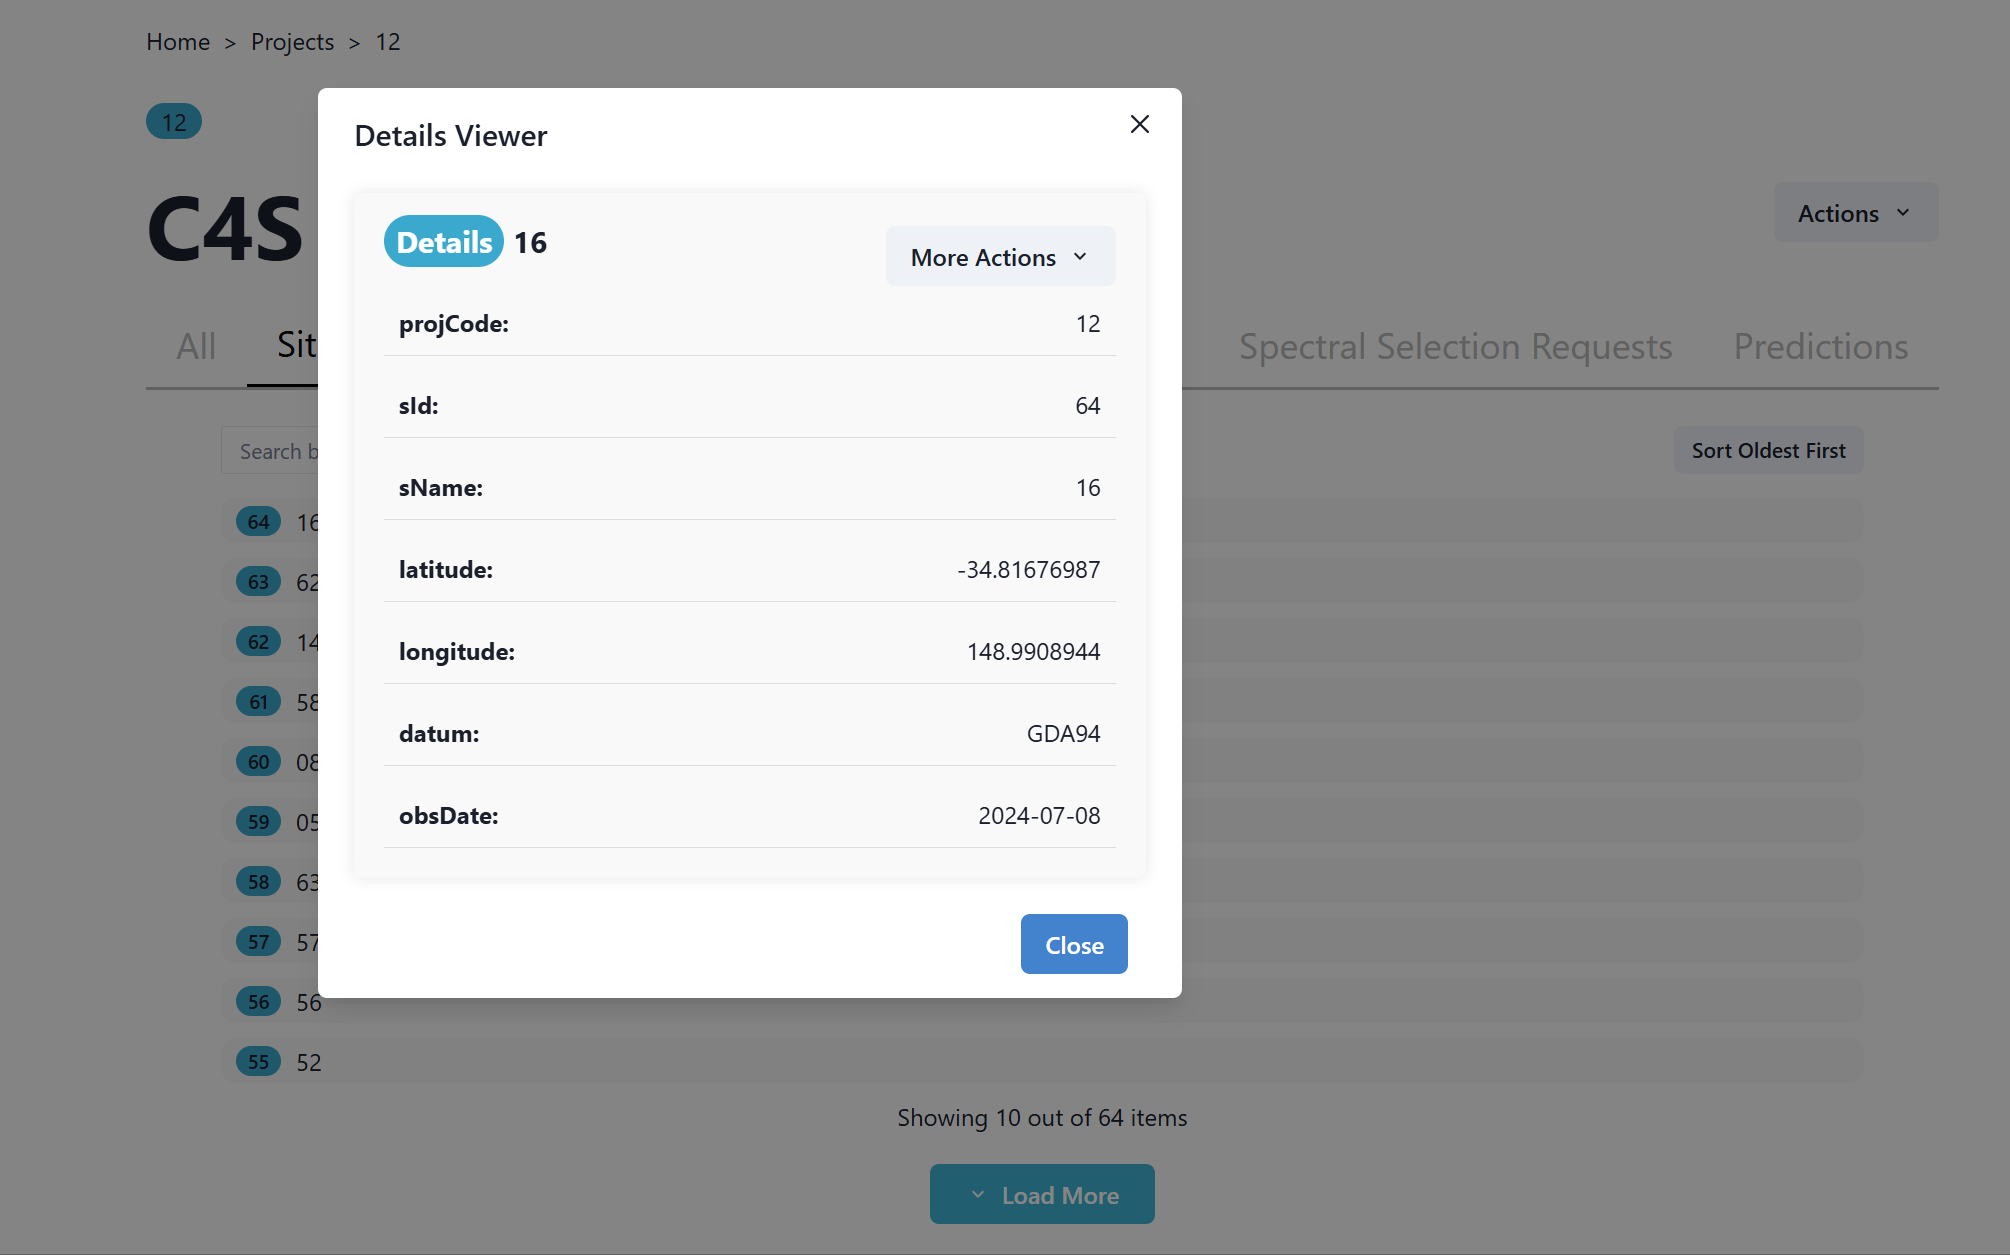
The second page under Sites allows the user to view the site information of the uploaded dataset.
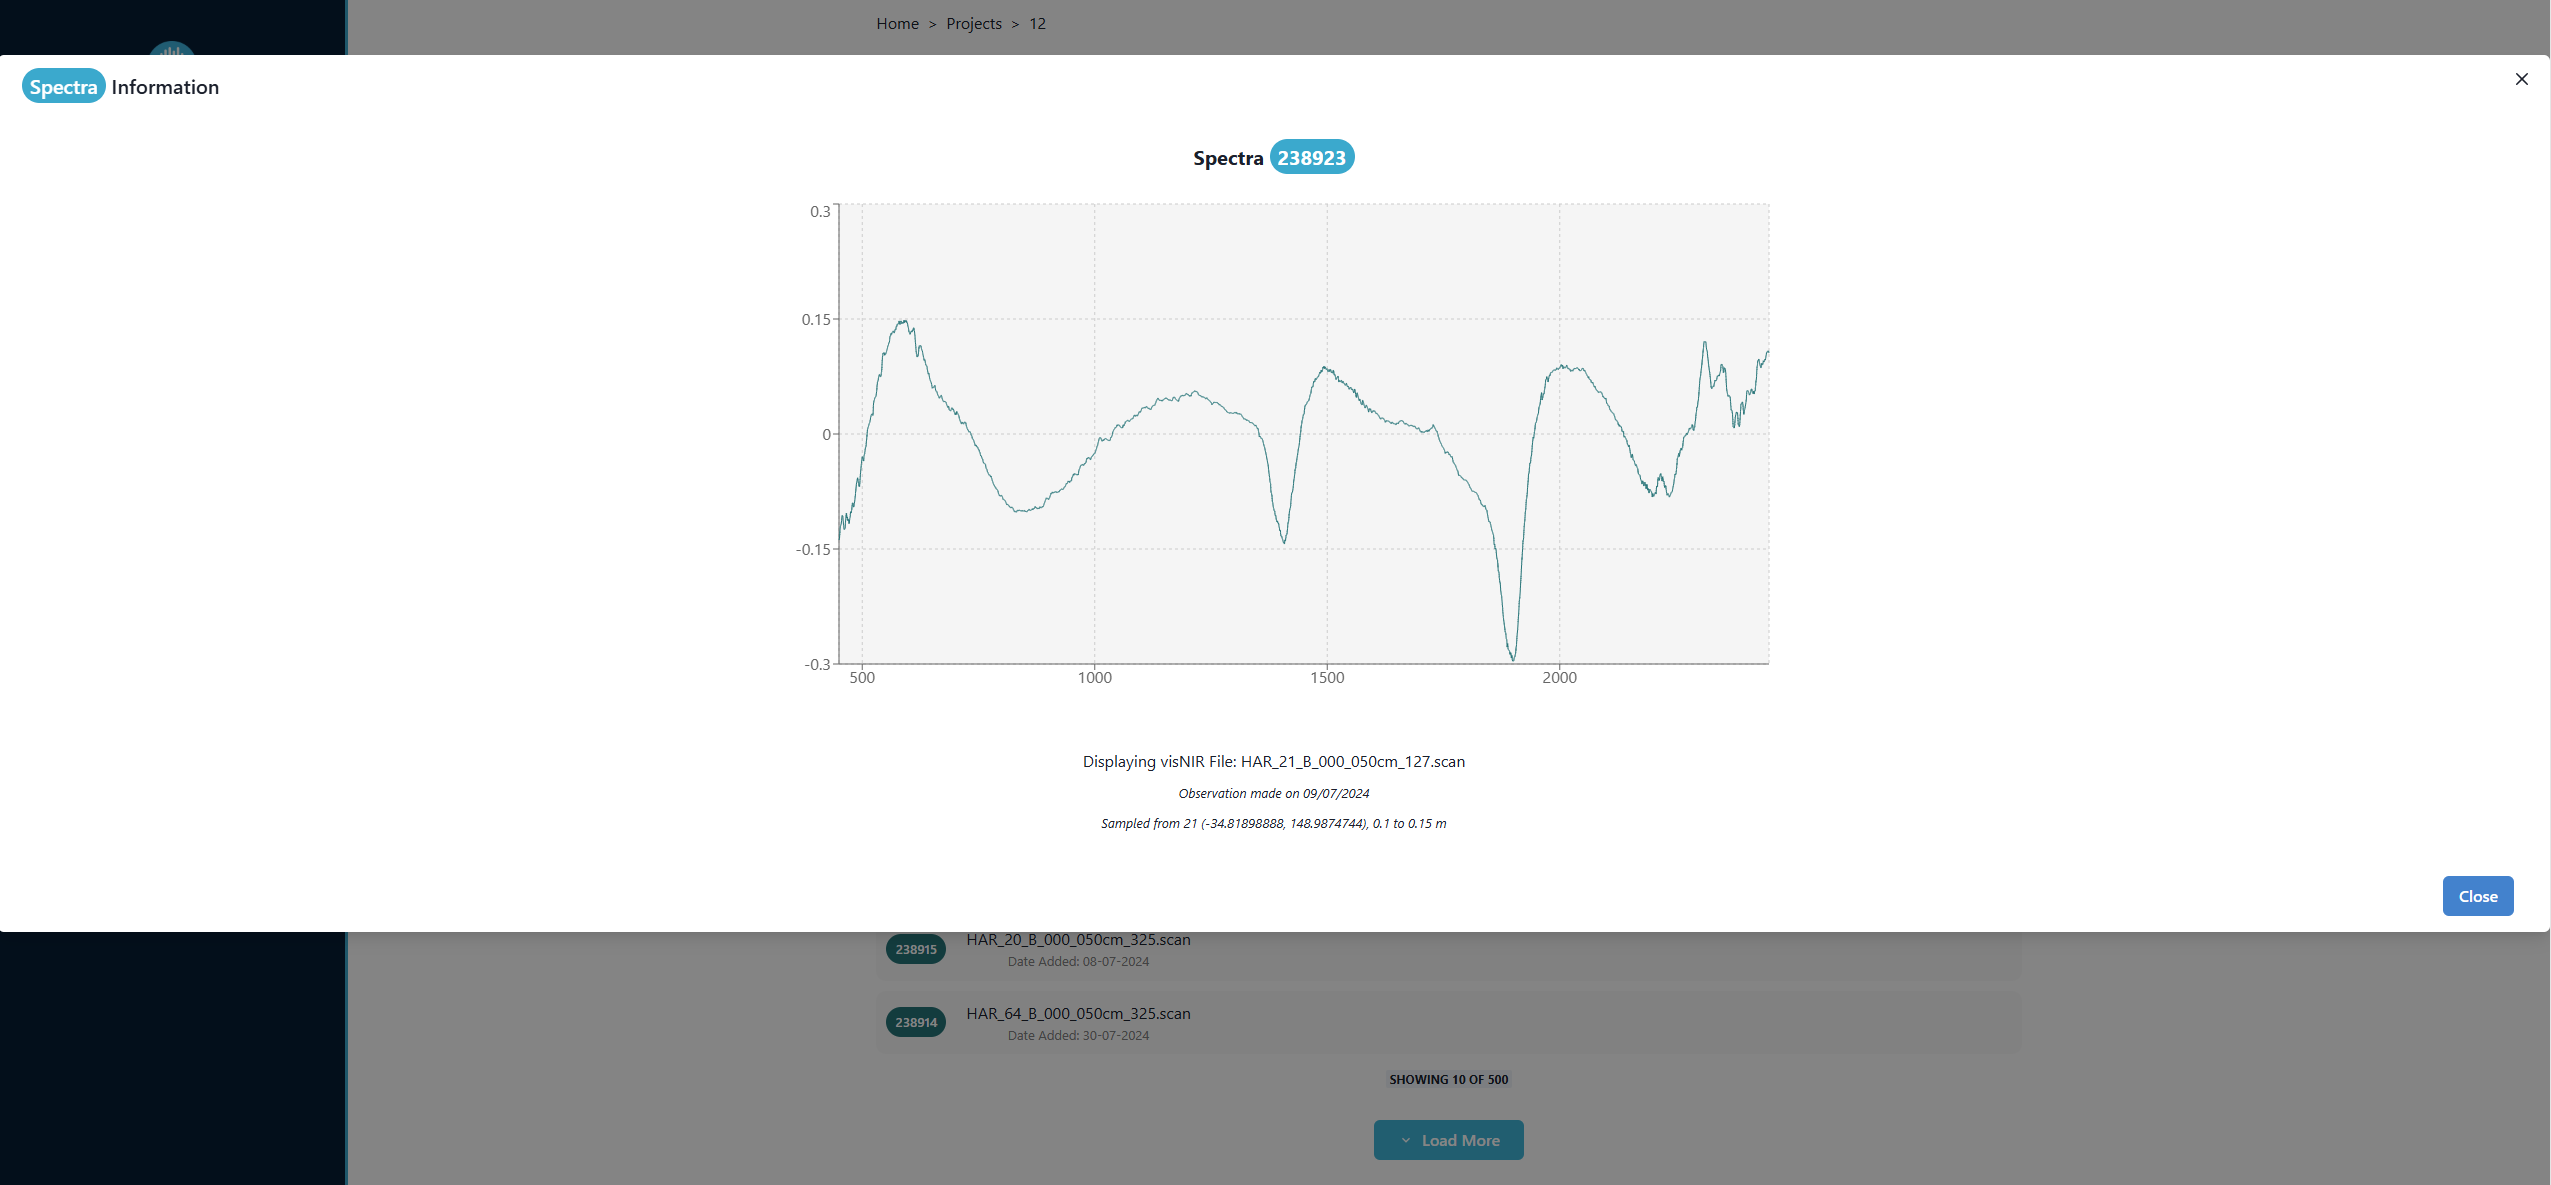
The third page under Spectra allows the user to view individual spectral information. Through visualization of the spectra uploaded, the user can also quickly check that the spectral condition corresponds to the Collection Method information. In the example below field condition spectra were uploaded by the user and spectra were corrected to remove the moisture effect and subsequently transformed. Under the C4S science more can be found out about the spectral transformations applied.
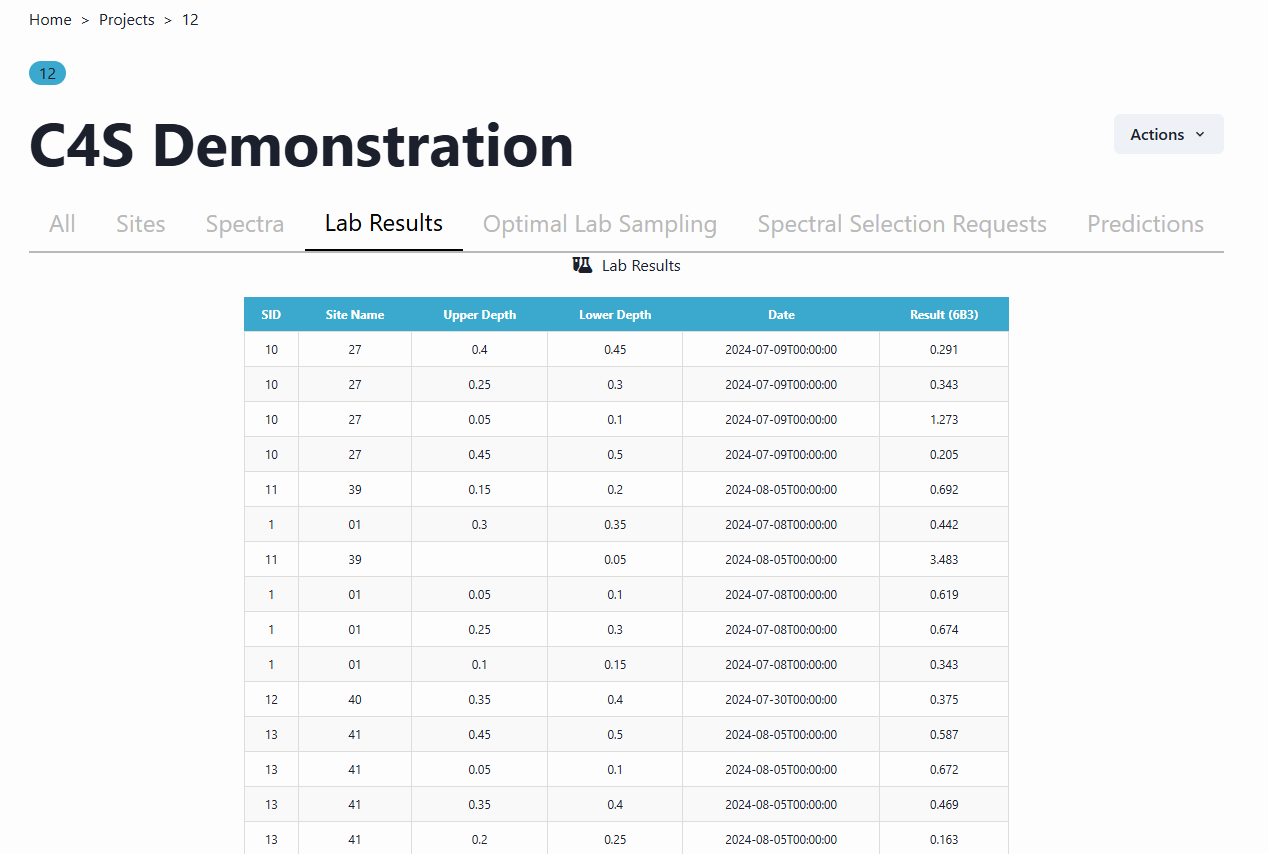
The fourth page under Lab Results allows the user to view soil laboratory analysis results, e.g. soil organic carbon corresponding to the analytical method 6B3 of dry combustion (6B3 - Total organic carbon Dumas high-temperature combustion with prior physical removal of charcoal and chemical removal of carbonates).
All laboratory method codes used in the C4S system correspond to the “Green Book” codes (Rayment, G.E. & D.J. Lyons (2011). Soil Chemical Methods - Australasia. CSIRO Publishing).
The remaining pages are covered through their own documentation page. Please navigate to these to find out more.