Soil Attribute Product Details
Soil Attribute Product Types
Which Soil Attribute Product Should I Use?
Modelled Soil Attributes
File Naming Conventions
Spatial Characteristics
Depth Layers
Data Acknowledgements
Soil Attribute Product Details
Soil Attribute Product Details
The Soil and Landscape Grid of Australia provides three sets of products:
- National Soil Attribute Maps, which are combinations of the;
- Australia-wide 3D Soil Attribute Maps derived using consistent data mining-kriging models and
- Regional Maps for parts of Australia, derived using disaggregation and data mining modeling.
Each of these products are described briefly below. The data for each of these three products can be accessed through this website, as well as the CSIRO's Data Access Portal (DAP) along with detailed metadata descriptions. The methodologies used are described in Viscarra Rossel et al. (2015) and Odgers et al. (2015).
Soil Attribute Product Types
(i) National Soil Attribute Maps
The Soil and Landscape Grid of Australia's National Soil Attribute Maps were generated by combining Australia-wide digital soil attribute maps derived using consistent data mining-kriging models and regional maps for parts of Australia, derived using disaggregation and regression modeling. The combination of these maps in areas where the regional maps were available, should increase the evidence base of the National Soil Attribute Maps. Where the regional data was available, the combination was performed using a variance weighted mean at each pixel.
(ii) Australia-wide three dimensional digital soil attribute maps
The Soil and Landscape Grid of Australia's, Australia-wide Soil Attribute Maps were generated using measured soil attribute data from existing databases in the national soil site data collation and spectroscopic estimates made with the CSIRO's National spectroscopic database (Viscarra Rossel & Webster, 2012). The spatial modeling was performed using decision trees with piecewise linear models and kriging of residuals. Fifty environmental covariates that represent climate, biota, terrain, and soil and parent material were used in the modeling. Uncertainty was derived using a bootstrap (Monte Carlo-type) approach to derive for each pixel a probability density function (pdf), from which we derived 90% confidence limits. The approach is described in Viscarra Rossel et al. (2015a).
(iii) Regional Maps
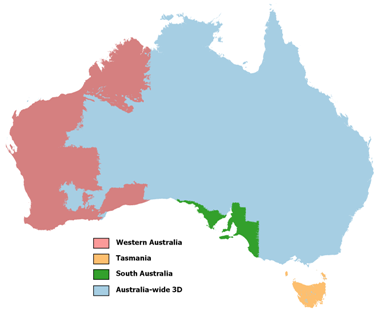
Regional maps were produced for parts of South Australia, parts of Western Australia, and for Tasmania. In Western Australia and South Australia a polygon map unit disaggregation technique called DSMART was used (Odgers et al., 2014). In these regions the disaggregation is based on the best contiguous soil polygon maps that were available for these areas. In Tasmania the soil attributes were modelled using decision trees with piecewise linear models using local scale input data and covariates. The areas across Australia covered by the regional maps are shown in the figure below.
Depth Layers - Please Note
The soil attribute products are provided as continuous maps that represent each of six depth intervals to a maximum depth of 2 metres. We acknowledge that soil depth is variable across Australia, and in some landscapes there might be no soil or soil might be shallower than 2 metres. We have provided maps to a depth of 2 metres because of the relative unavailability of data on soil depth. Further, existing data on depth is biased to near surface layers and there are few records that extend beyond 1.5m. Therefore, we provide separately, our best estimate of soil depth to allow users to generate masks, which might be used together with the attribute maps to approximate the presence of areas with no soil or areas with shallow soil. We encourage users to draw on local data and expertise for such assessments.
Which Soil Attribute Product Should I Use?
All of the products available from the Soil and Landscape Grid of Australia are derived using spatial modeling to describe the distribution of soil attributes across all of Australia, or parts thereof as described above. These products provide consistent and continuous estimate of functional soil attributes in an easily accessible form and using the best available soil information for Australia. Which product you use will depend on your application:
- National Soil Attribute Maps - these maps provide the best estimates of soil attributes using all of the currently available soil information, both site data and polygon soil maps, in the regions where they were available (see figure above). At all other locations the estimates are the same as those in the Australia-wide digital soil attribute maps. We note that in the combined regions, the uncertainties around the estimates are wider than those of the same areas in the Australia-wide maps.
- Australia-wide 3D Soil Attribute Maps - these maps provide the best estimates of soil attributes across the whole of Australia that are derived using only site data and spectroscopic estimates and using one consistent spatial modelling methodology that accounts for model and spatial uncertainties.
- Regional Maps - these maps provide regional estimates that most closely adhere to existing local soil mapping.
We acknowledge that there are other forms of soil information available from state and territory soil survey agencies across different parts of the country with maps that have more or less detailed resolutions that are derived for different other purposes.
All of the soil attribute products available from the Soil and Landscape Grid of Australia are the outcomes from modelling that describe the spatial distribution of soil attributes across parts of, and the whole of Australia using existing soil data and environmental covariates. There are other forms of soil information available in each state and territory and across the country. State and federal soil survey agencies along with some universities often have different forms of soil information (eg. soil type, land suitability or capability) or more detailed soil datasets or maps that have been designed for other purposes. They were also used to derive the Soil and Landscape Grid of Australia. The products in the grid are designed to provide consistent and continuous estimates of functional soil attributes in an easily accessible form.
Available Modelled Soil Attributes
All of the products listed below have been modelled for the National maps and various combinations have been modelled in each region. Method summaries for the new and updated attributes can be found HERE| Attribute | Description | Units |
| Available Phosphorus - New |
Available Phosphorus | mg/kg |
| Drained Upper Limit - New |
Volumetric Drained Upper Limit (1/3 Bar) | % |
| Lower Limit - New |
Volumetric Lower Limit (15 Bar) | % |
| Available Water Capacity - Updated |
Available water capacity computed for each of the specified depth increments | % |
| Bulk Density (whole earth) | Bulk Density of the whole soil (including coarse fragments) in mass per unit volume by a method equivalent to the core method | g/cm3 |
| Coarse Fragments - New |
Proportion of coarse fragments size class | None |
| Effective Cation Exchange Capacity | Cations extracted using barium chloride (BaCl2) plus exchangeable H + Al | meq/100g |
| Cation Exchange Capacity | Cations extracted using barium chloride (BaCl2) | meq/100g |
| Clay - Updated |
< 2 um mass fraction of the < 2 mm soil material determined using the pipette method | % |
| Silt - Updated |
2-20 um mass fraction of the < 2 mm soil material determined using the pipette method | % |
| Sand - Updated |
20 um - 2 mm mass fraction of the < 2 mm soil material determined using the pipette method | % |
| Depth of Regolith | Depth to hard rock. Depth is inclusive of all regolith | m |
| Depth of Soil - Updated |
Depth of soil profile (A & B horizons). | m |
| Microbial Biodiversity - New |
Soil bacteria and fungi beta diversity | None |
| Organic Carbon - Updated |
Mass fraction of carbon by weight in the < 2 mm soil material as determined by dry combustion at 900 Celcius. Available at 90 and 30 metre resolution. | % |
| Organic Carbon Fractions - New |
Proportions of mineral-associated organic carbon (MAOC), particulate organic carbon (POC) and pyrogenic organic carbon (PyOC) | % |
| pH (Water) - New |
pH of a 1:5 soil water solution | none |
| pH (CaCl2) | pH of 1:5 soil/0.01M calcium chloride extract | none |
| Total Nitrogen | Mass fraction of total nitrogen in the soil by weight | % |
| Total Phosphorus | Mass fraction of total phosphorus in the soil by weight | % |
Soil attribute values are estimated at 6 defined depth intervals, as specified in the GlobalSoilMap specifications. These depth intervals are 0-5cm, 5-15cm, 15-30cm, 30-60cm, 60-100cm and 100-200cm.
All of the maps are accompanied by an estimate of the reliability of the predictions for each pixel in the grid. These reliability estimates are in the form of a lower 5% confidence interval map and an upper 95% confidence interval map. In general terms, this means that 90% of the time the model value is expected to be within the range of the values given by these confidence intervals.
File Naming Conventions
All of the products in the Australian Soil and Landscape Grid are supplied as geotiff raster files. We have adopted a structured file naming convention to uniquely identify the Grid products.
Spatial Characteristics
All of the products in the Australian Soil and Landscape Grid conform to the spatial structure described in the GlobalSoilMap Specifications. Below is a summary of the spatial characteristics of the Soil Attribute products.
| Product | Projection | Cell Size | No.Rows | No.Cols | Min East | Min North | Max East | Max North |
| National Maps | WGS84 - EPSG:4326 | 3 arc seconds | 40800 | 49200 | 112.99958 | -44.00042 | 153.99958 | -10.0004 |
| Australia-wide 3D Maps | WGS84 - EPSG:4326 | 3 arc seconds | 40800 | 49200 | 112.99958 | -44.00042 | 153.99958 | -10.0004 |
| Western Australia Maps | WGS84 - EPSG:4326 | 3 arc seconds | 25670 | 19315 | 112.99958 | -35.13458 | 129.09542 | -13.7429 |
| South Australia Maps | WGS84 - EPSG:4326 | 3 arc seconds | 7930 | 11317 | 131.58708 | -38.12958 | 141.01792 | -31.5213 |
| Tasmania | WGS84 - EPSG:4326 | 3 arc seconds | 5194 | 5899 | 143.73458 | -43.70625 | 148.65042 | -39.3779 |
Data Acknowledgements
The modelling approaches used to develop the National Soil Attribute Maps use a range of data from a variety of sources. We gratefully acknowledge the supply of soil data from the our collaborating State and Territory soil survey agencies as listed on the Partners page of this website.
Environmental covariate data sets were sourced from the organisations listed in the table below. The availability of these data sets is gratefully acknowledged.
| Organisation | Web Link |
| Australian Bureau of Meteorology | http://www.bom.gov.au/climate/averages/maps.shtml |
| Geoscience Australia | http://www.ga.gov.au/data-pubs |
| CSIRO | https://data.csiro.au/ |
| TERN Landscapes | https://www.tern.org.au/tern-observatory/landscape-monitoring-and-observation/ |