SLGA Cloud Optimised GeoTiff DataStore Home
The datasets listed here comprise the latest version of the TERN Soil and Landscape Grid of Australia. They are stored as Cloud Optimised Geotiffs (COGs). You can download them from here or access them directly from here using you favourite COGs viewer - ours is QGIS. Click on the left most icon to view an enlarged image for the dataset. Click on the "Copy URL" to copy the URL of the data set into the computer clipboard for pasting into you viewer. Click on the name link to download the whole dataset. Examples of accessing COGS can be found HERE.
Click on the sections below to show the URLs for the Cloud Optimised GeoTIFFS.
The URLs in this section are for the current version products of the 90m resolution products of the Soil and Landscape Grid
| Got to the web directory for this product | ||||
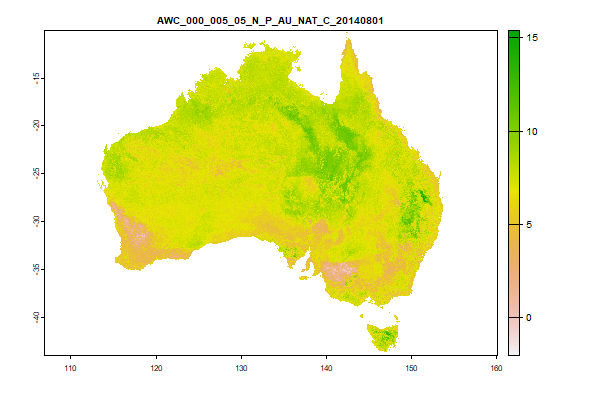
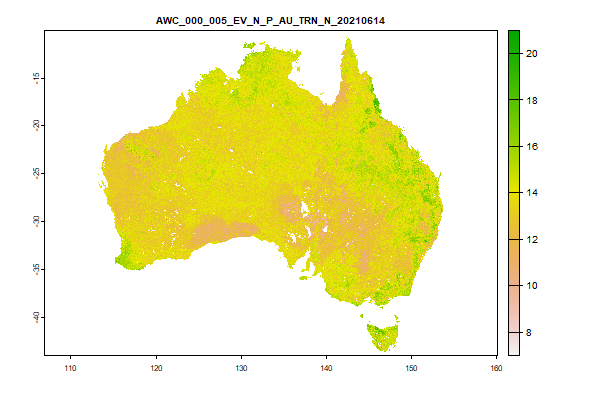 Click to enlarge the image
|
|
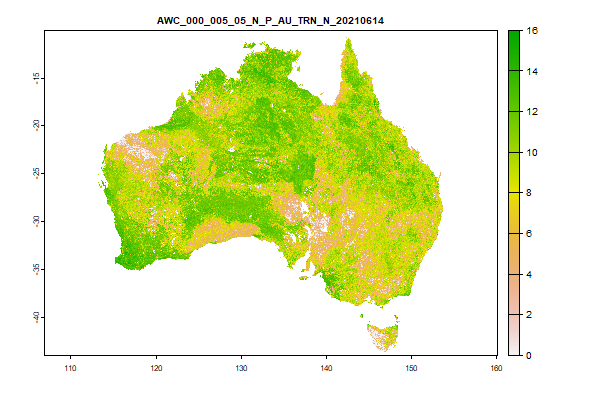
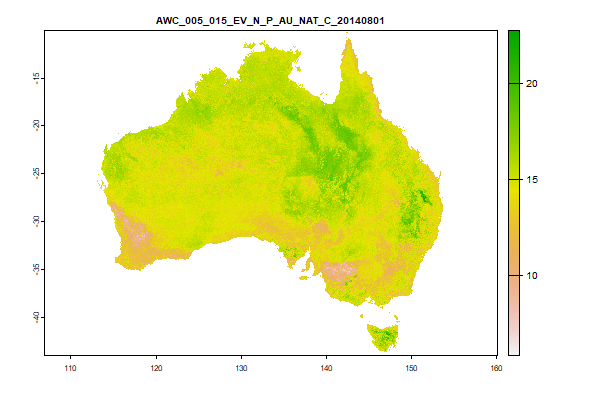
306.2 Mb | AWC_000_005_EV_N_P_AU_TRN_N_20210614.tif | The Modelled-Value for Available Water Capacity (%) at 0 to 0.05 metres |
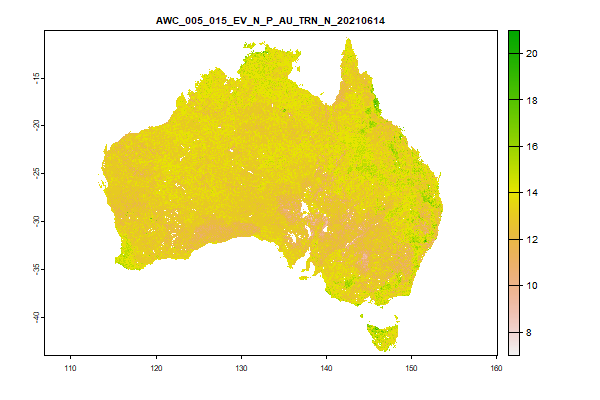 Click to enlarge the image
|
|
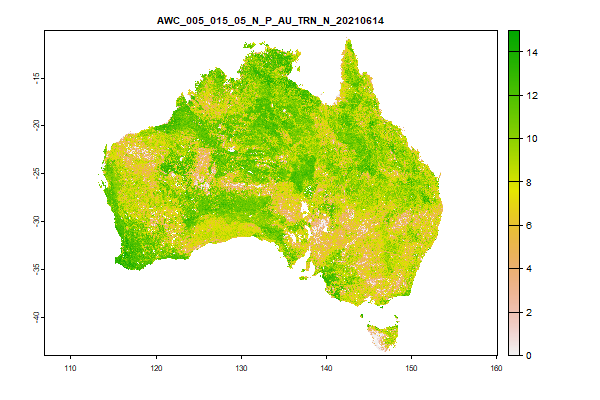
292 Mb | AWC_005_015_EV_N_P_AU_TRN_N_20210614.tif | The Modelled-Value for Available Water Capacity (%) at 0.05 to 0.15 metres |
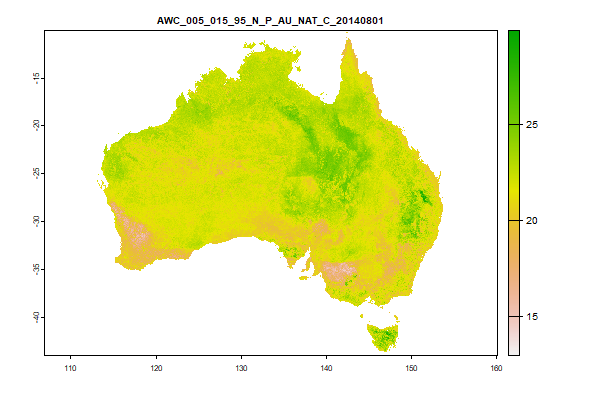
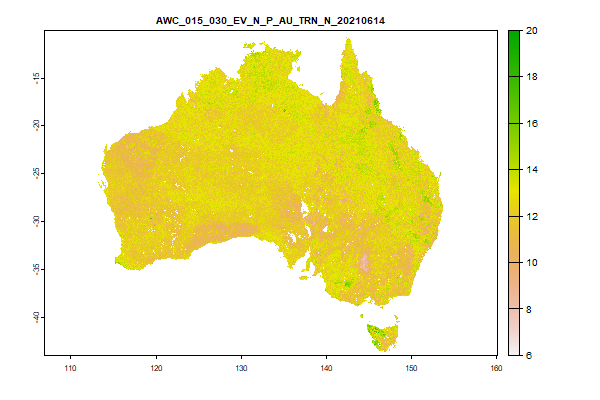 Click to enlarge the image
|
|
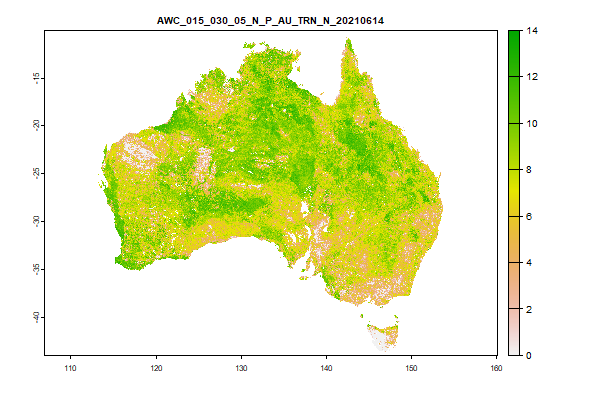
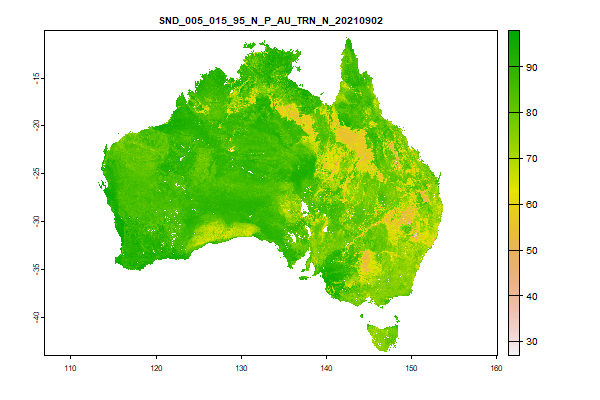
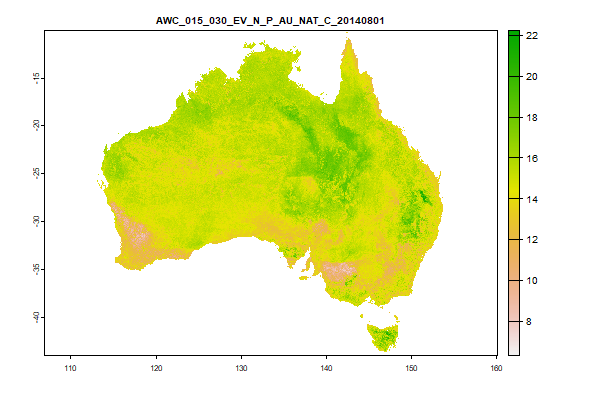
298.5 Mb | AWC_015_030_EV_N_P_AU_TRN_N_20210614.tif | The Modelled-Value for Available Water Capacity (%) at 0.15 to 0.3 metres |
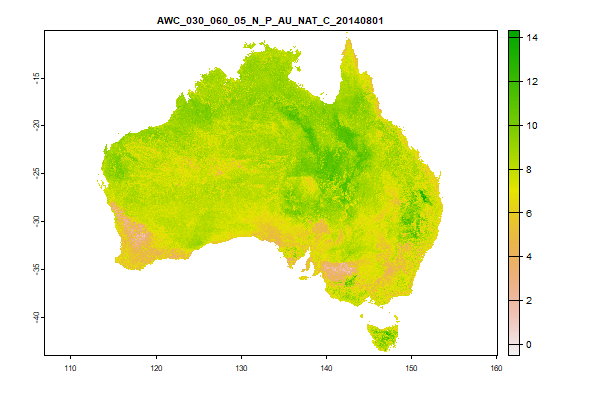
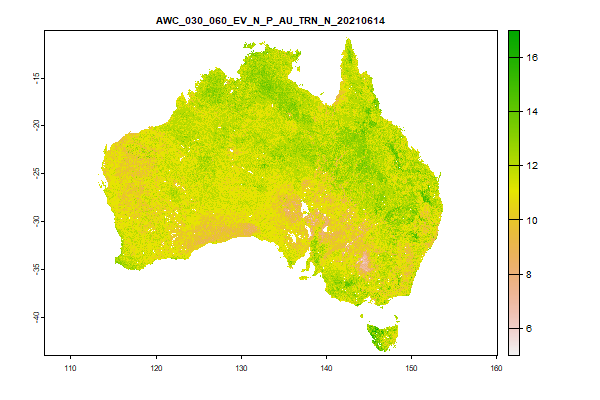 Click to enlarge the image
|
|
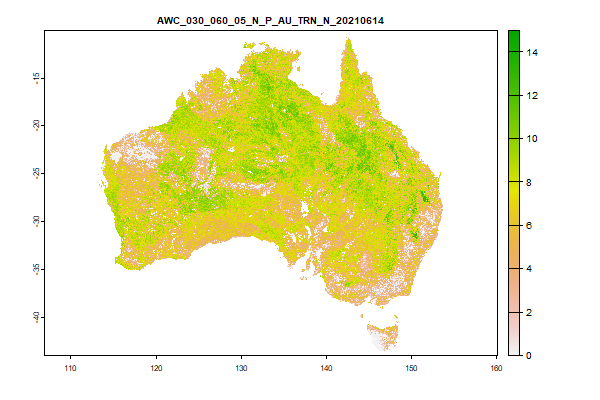
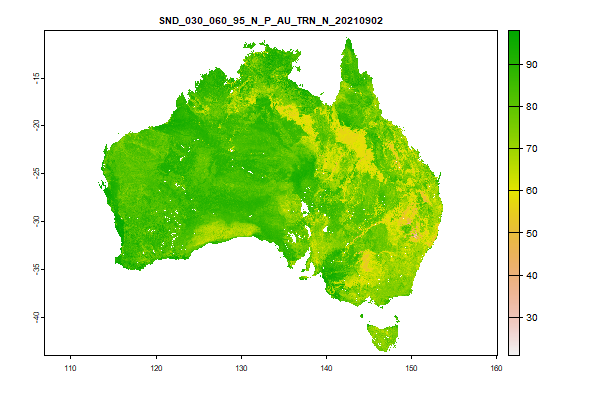
302.9 Mb | AWC_030_060_EV_N_P_AU_TRN_N_20210614.tif | The Modelled-Value for Available Water Capacity (%) at 0.3 to 0.6 metres |
 Click to enlarge the image
|
|
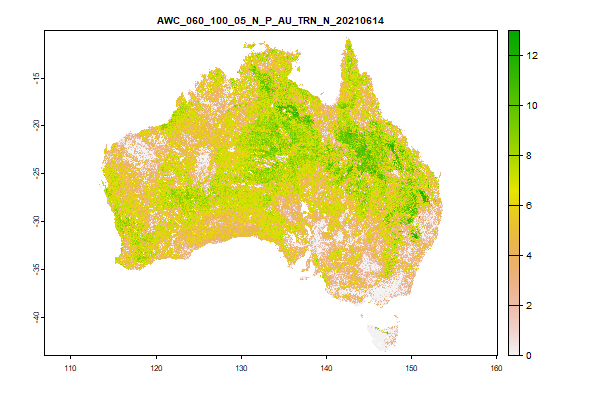
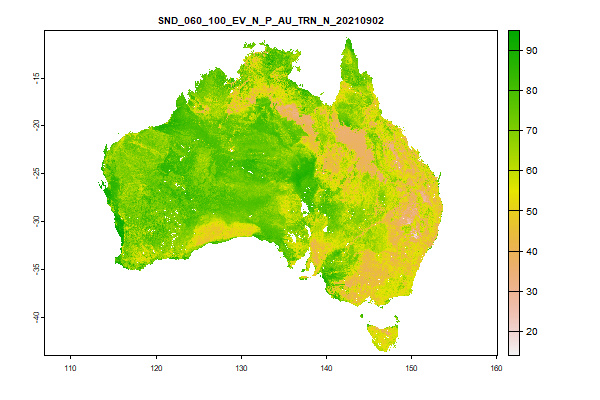
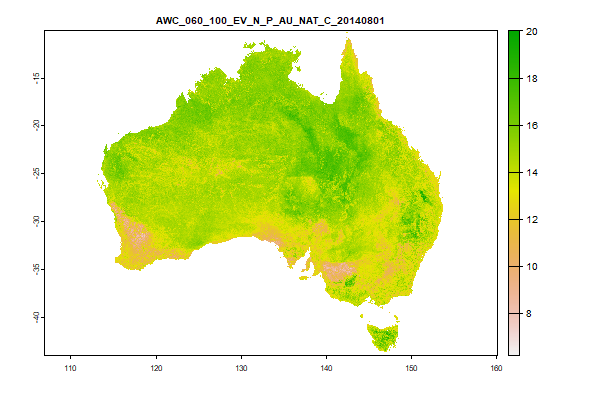
307.3 Mb | AWC_060_100_EV_N_P_AU_TRN_N_20210614.tif | The Modelled-Value for Available Water Capacity (%) at 0.6 to 1 metres |
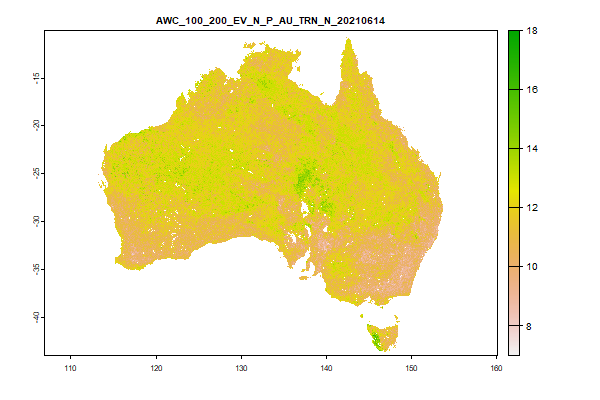 Click to enlarge the image
|
|
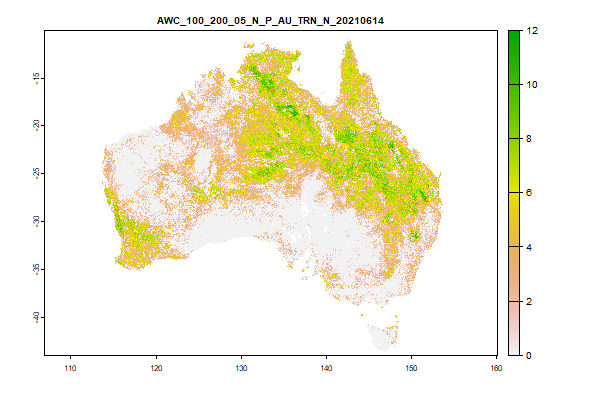
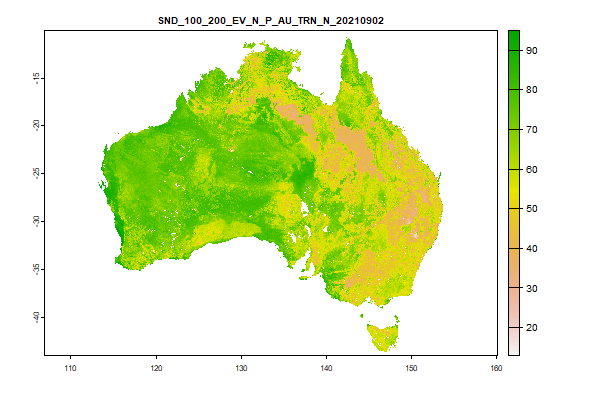
304.2 Mb | AWC_100_200_EV_N_P_AU_TRN_N_20210614.tif | The Modelled-Value for Available Water Capacity (%) at 1 to 2 metres |
 Click to enlarge the image
|
|
503.1 Mb | AWC_000_005_05_N_P_AU_TRN_N_20210614.tif | The Lower-CI for Available Water Capacity (%) at 0 to 0.05 metres |
 Click to enlarge the image
|
|
502.1 Mb | AWC_005_015_05_N_P_AU_TRN_N_20210614.tif | The Lower-CI for Available Water Capacity (%) at 0.05 to 0.15 metres |
 Click to enlarge the image
|
|
494.1 Mb | AWC_015_030_05_N_P_AU_TRN_N_20210614.tif | The Lower-CI for Available Water Capacity (%) at 0.15 to 0.3 metres |
 Click to enlarge the image
|
|
486.8 Mb | AWC_030_060_05_N_P_AU_TRN_N_20210614.tif | The Lower-CI for Available Water Capacity (%) at 0.3 to 0.6 metres |
 Click to enlarge the image
|
|
476.6 Mb | AWC_060_100_05_N_P_AU_TRN_N_20210614.tif | The Lower-CI for Available Water Capacity (%) at 0.6 to 1 metres |
 Click to enlarge the image
|
|
384.1 Mb | AWC_100_200_05_N_P_AU_TRN_N_20210614.tif | The Lower-CI for Available Water Capacity (%) at 1 to 2 metres |
 Click to enlarge the image
|
|
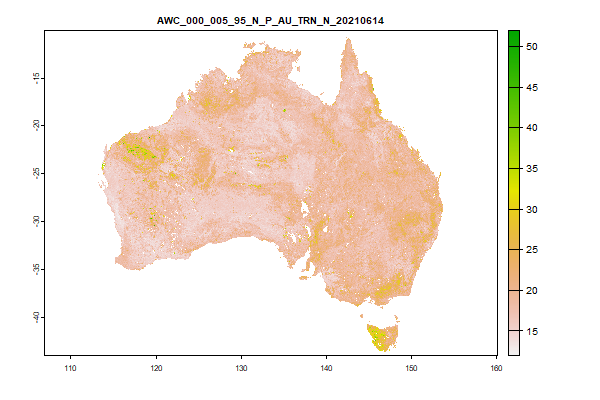
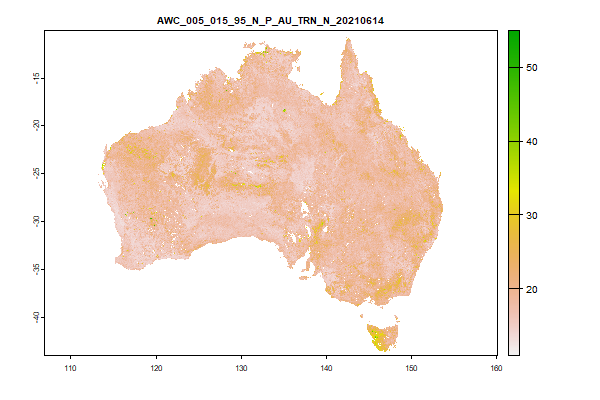
517.8 Mb | AWC_000_005_95_N_P_AU_TRN_N_20210614.tif | The Upper-CI for Available Water Capacity (%) at 0 to 0.05 metres |
 Click to enlarge the image
|
|
515.3 Mb | AWC_005_015_95_N_P_AU_TRN_N_20210614.tif | The Upper-CI for Available Water Capacity (%) at 0.05 to 0.15 metres |
 Click to enlarge the image
|
|
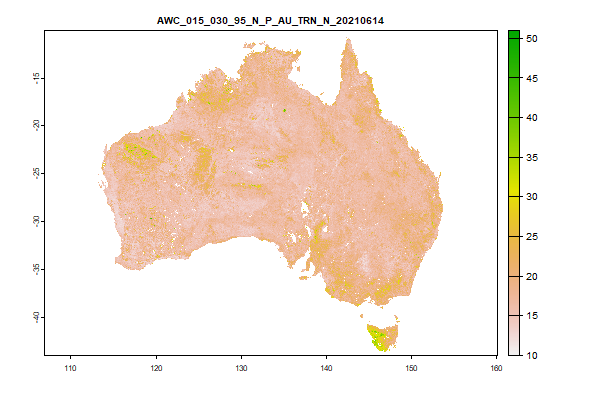
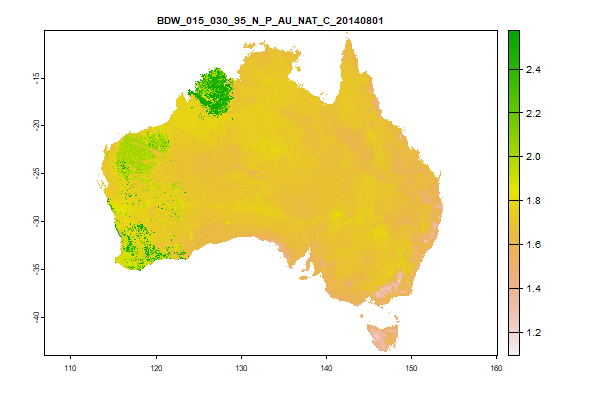
521.6 Mb | AWC_015_030_95_N_P_AU_TRN_N_20210614.tif | The Upper-CI for Available Water Capacity (%) at 0.15 to 0.3 metres |
 Click to enlarge the image
|
|
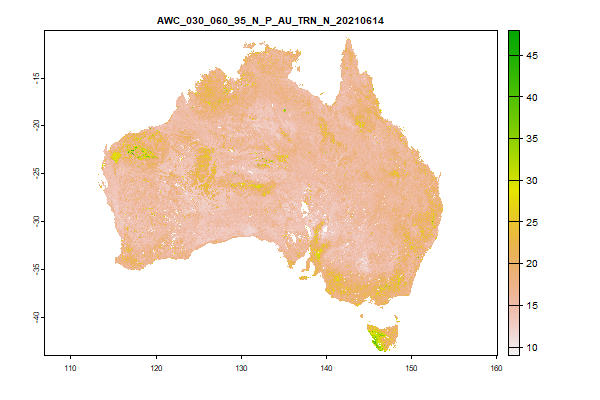
513.3 Mb | AWC_030_060_95_N_P_AU_TRN_N_20210614.tif | The Upper-CI for Available Water Capacity (%) at 0.3 to 0.6 metres |
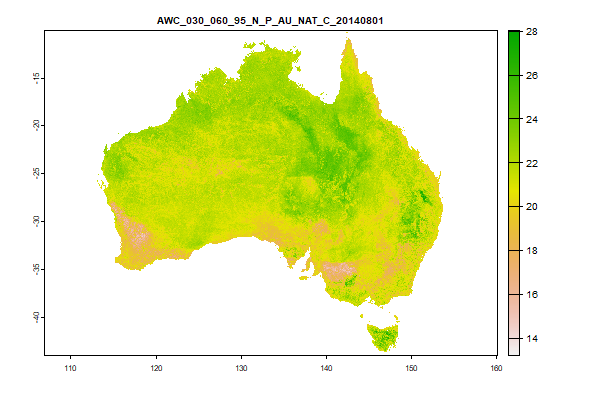
 Click to enlarge the image
|
|
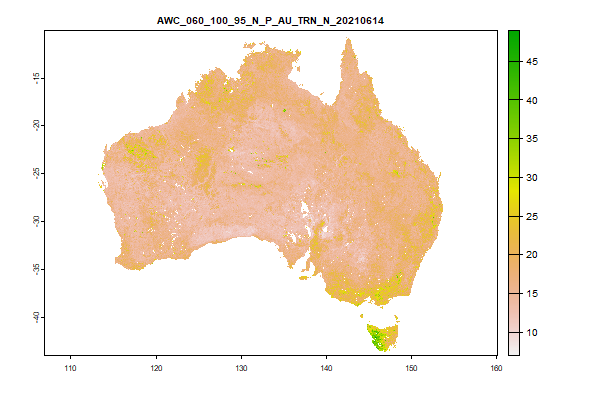
526.8 Mb | AWC_060_100_95_N_P_AU_TRN_N_20210614.tif | The Upper-CI for Available Water Capacity (%) at 0.6 to 1 metres |
 Click to enlarge the image
|
|
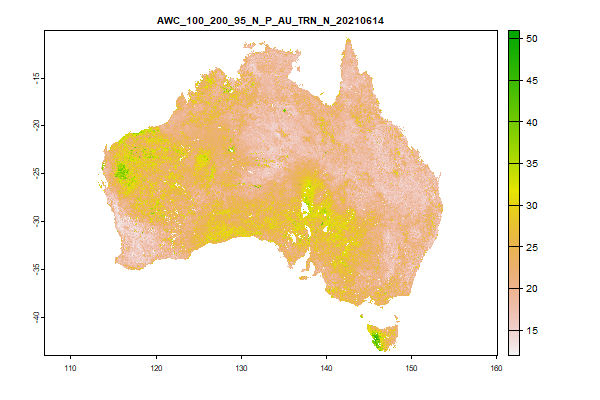
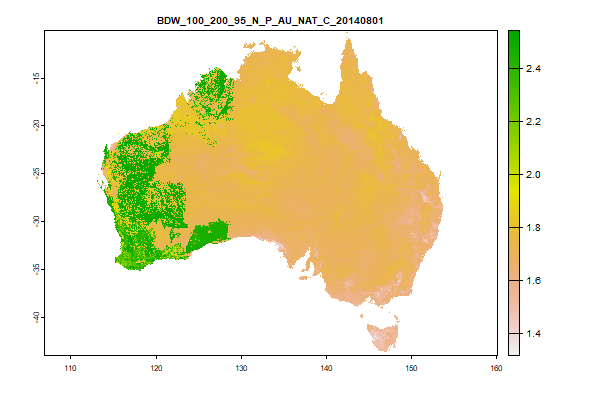
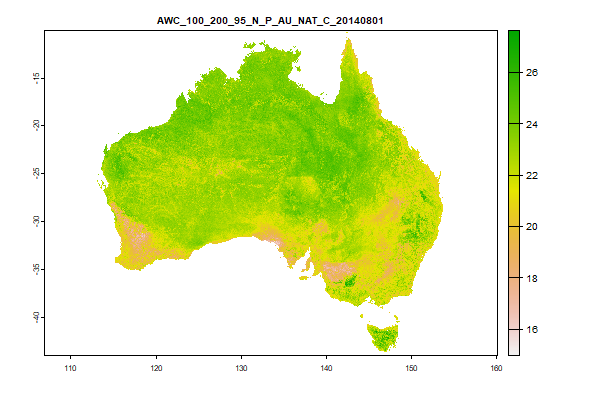
610.4 Mb | AWC_100_200_95_N_P_AU_TRN_N_20210614.tif | The Upper-CI for Available Water Capacity (%) at 1 to 2 metres |
| Got to the web directory for this product | ||||
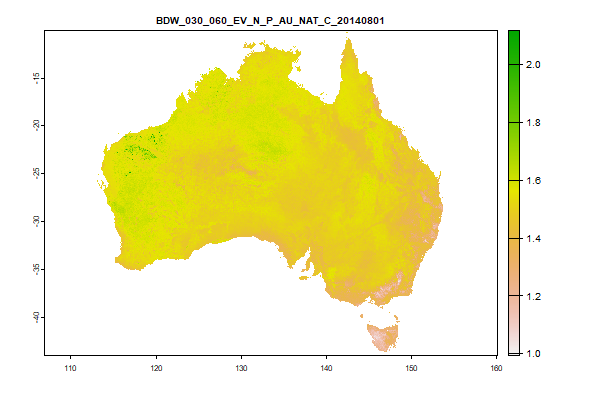
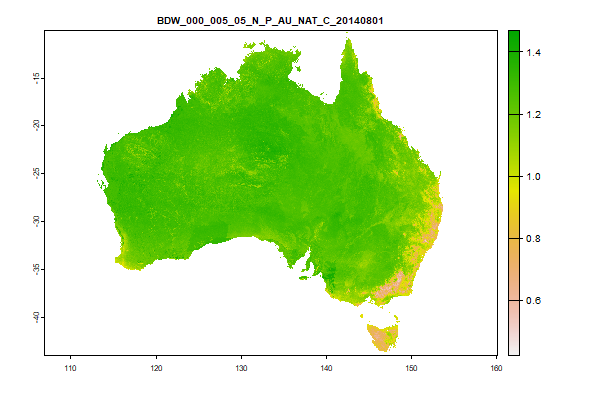
 Click to enlarge the image
|
|
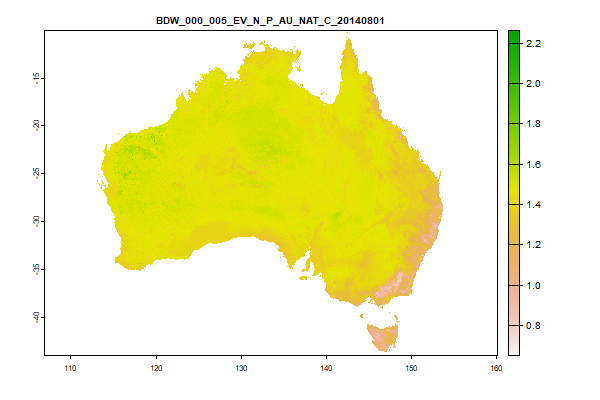
3.3 Gb | BDW_000_005_EV_N_P_AU_NAT_C_20140801.tif | The Modelled-Value for Bulk Density (whole earth) (g/cm3) at 0 to 0.05 metres |
 Click to enlarge the image
|
|
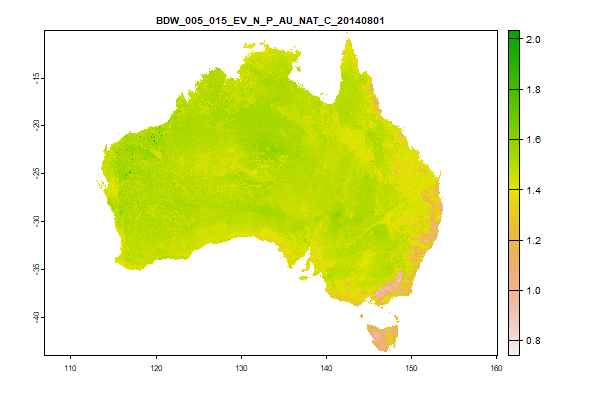
3.3 Gb | BDW_005_015_EV_N_P_AU_NAT_C_20140801.tif | The Modelled-Value for Bulk Density (whole earth) (g/cm3) at 0.05 to 0.15 metres |
 Click to enlarge the image
|
|
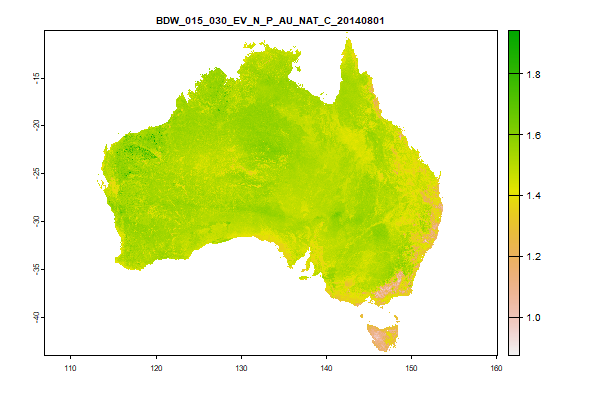
3.3 Gb | BDW_015_030_EV_N_P_AU_NAT_C_20140801.tif | The Modelled-Value for Bulk Density (whole earth) (g/cm3) at 0.15 to 0.3 metres |
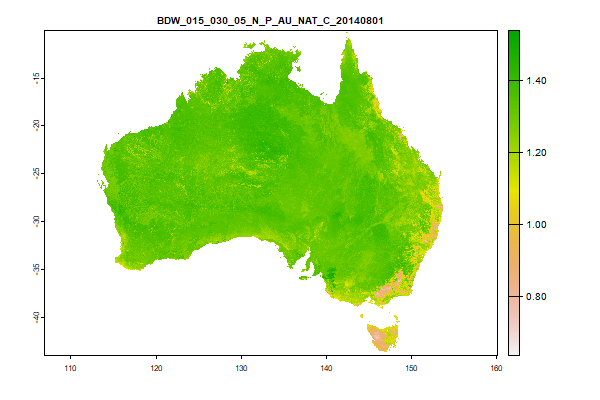
 Click to enlarge the image
|
|
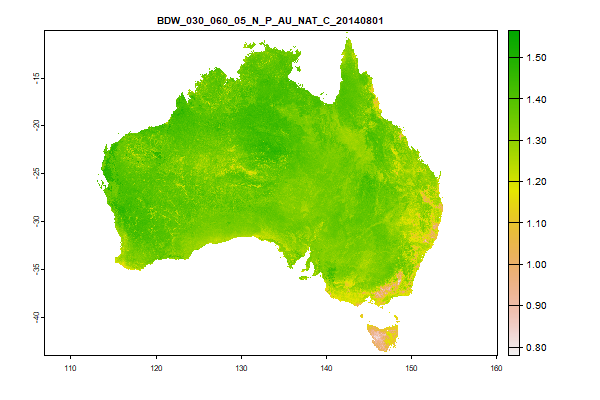
3.3 Gb | BDW_030_060_EV_N_P_AU_NAT_C_20140801.tif | The Modelled-Value for Bulk Density (whole earth) (g/cm3) at 0.3 to 0.6 metres |
 Click to enlarge the image
|
|
3.3 Gb | BDW_060_100_EV_N_P_AU_NAT_C_20140801.tif | The Modelled-Value for Bulk Density (whole earth) (g/cm3) at 0.6 to 1 metres |
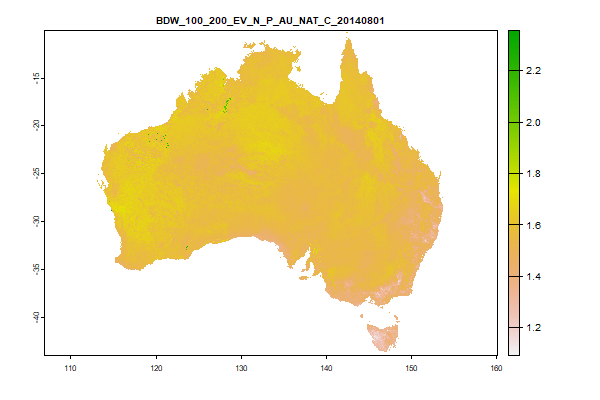 Click to enlarge the image
|
|
3.3 Gb | BDW_100_200_EV_N_P_AU_NAT_C_20140801.tif | The Modelled-Value for Bulk Density (whole earth) (g/cm3) at 1 to 2 metres |
 Click to enlarge the image
|
|
3.3 Gb | BDW_000_005_05_N_P_AU_NAT_C_20140801.tif | The Lower-CI for Bulk Density (whole earth) (g/cm3) at 0 to 0.05 metres |
 Click to enlarge the image
|
|
3.3 Gb | BDW_005_015_05_N_P_AU_NAT_C_20140801.tif | The Lower-CI for Bulk Density (whole earth) (g/cm3) at 0.05 to 0.15 metres |
 Click to enlarge the image
|
|
3.3 Gb | BDW_015_030_05_N_P_AU_NAT_C_20140801.tif | The Lower-CI for Bulk Density (whole earth) (g/cm3) at 0.15 to 0.3 metres |
 Click to enlarge the image
|
|
3.3 Gb | BDW_030_060_05_N_P_AU_NAT_C_20140801.tif | The Lower-CI for Bulk Density (whole earth) (g/cm3) at 0.3 to 0.6 metres |
 Click to enlarge the image
|
|
3.3 Gb | BDW_060_100_05_N_P_AU_NAT_C_20140801.tif | The Lower-CI for Bulk Density (whole earth) (g/cm3) at 0.6 to 1 metres |
 Click to enlarge the image
|
|
3.3 Gb | BDW_100_200_05_N_P_AU_NAT_C_20140801.tif | The Lower-CI for Bulk Density (whole earth) (g/cm3) at 1 to 2 metres |
 Click to enlarge the image
|
|
3.3 Gb | BDW_000_005_95_N_P_AU_NAT_C_20140801.tif | The Upper-CI for Bulk Density (whole earth) (g/cm3) at 0 to 0.05 metres |
 Click to enlarge the image
|
|
3.3 Gb | BDW_005_015_95_N_P_AU_NAT_C_20140801.tif | The Upper-CI for Bulk Density (whole earth) (g/cm3) at 0.05 to 0.15 metres |
 Click to enlarge the image
|
|
3.3 Gb | BDW_015_030_95_N_P_AU_NAT_C_20140801.tif | The Upper-CI for Bulk Density (whole earth) (g/cm3) at 0.15 to 0.3 metres |
 Click to enlarge the image
|
|
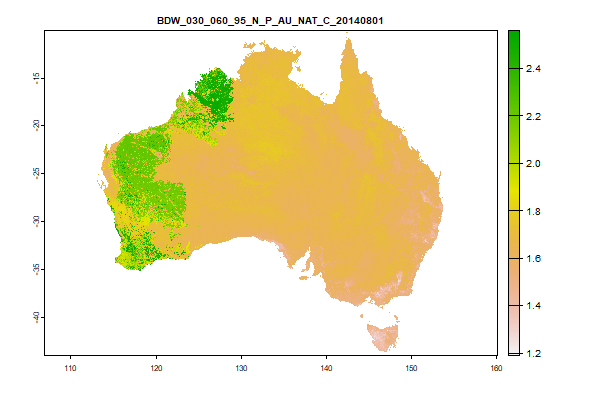
3.3 Gb | BDW_030_060_95_N_P_AU_NAT_C_20140801.tif | The Upper-CI for Bulk Density (whole earth) (g/cm3) at 0.3 to 0.6 metres |
 Click to enlarge the image
|
|
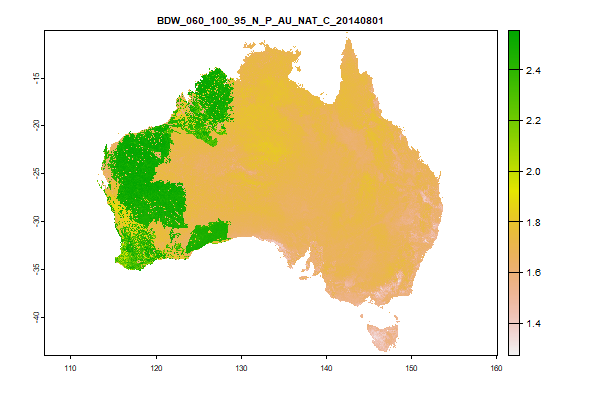
3.3 Gb | BDW_060_100_95_N_P_AU_NAT_C_20140801.tif | The Upper-CI for Bulk Density (whole earth) (g/cm3) at 0.6 to 1 metres |
 Click to enlarge the image
|
|
3.3 Gb | BDW_100_200_95_N_P_AU_NAT_C_20140801.tif | The Upper-CI for Bulk Density (whole earth) (g/cm3) at 1 to 2 metres |
| Got to the web directory for this product | ||||
 Click to enlarge the image
|
|
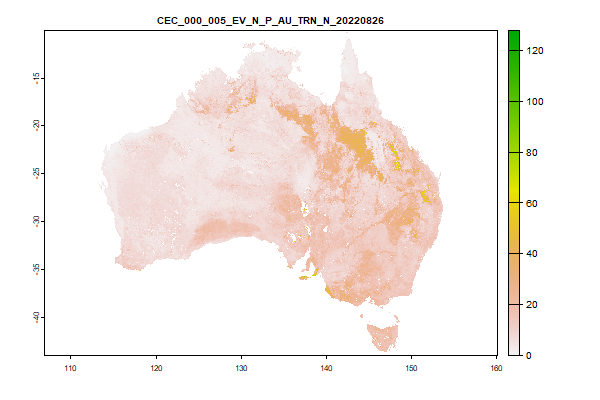
508.8 Mb | CEC_000_005_EV_N_P_AU_TRN_N_20220826.tif | The Modelled-Value for Cation Exchange Capacity (meq/100g) at 0 to 0.05 metres |
 Click to enlarge the image
|
|
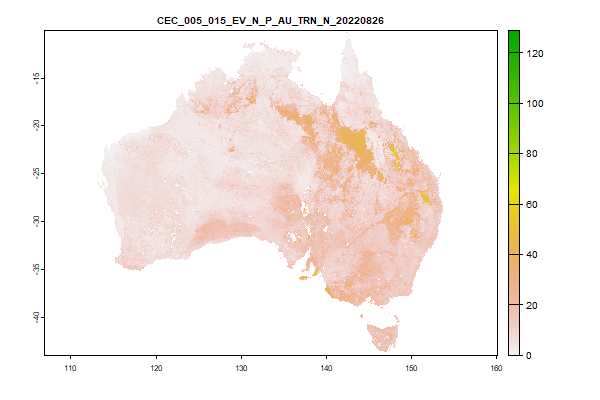
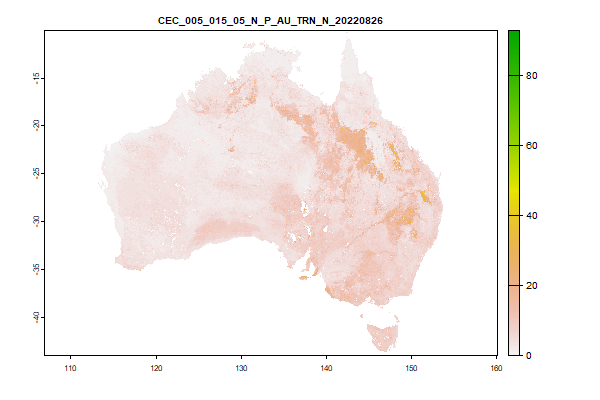
513.4 Mb | CEC_005_015_EV_N_P_AU_TRN_N_20220826.tif | The Modelled-Value for Cation Exchange Capacity (meq/100g) at 0.05 to 0.15 metres |
 Click to enlarge the image
|
|
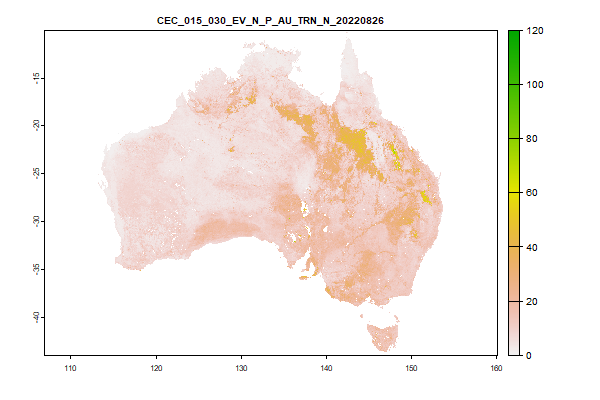
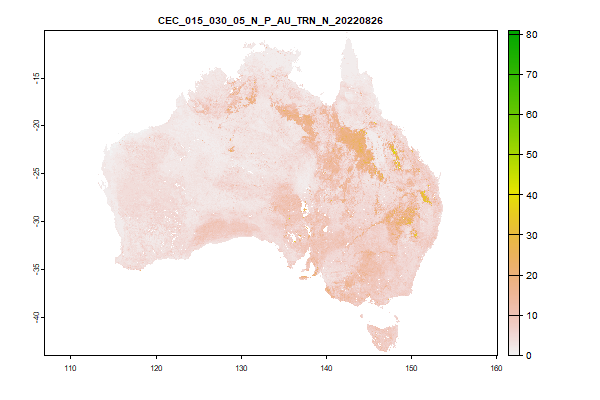
533.8 Mb | CEC_015_030_EV_N_P_AU_TRN_N_20220826.tif | The Modelled-Value for Cation Exchange Capacity (meq/100g) at 0.15 to 0.3 metres |
 Click to enlarge the image
|
|
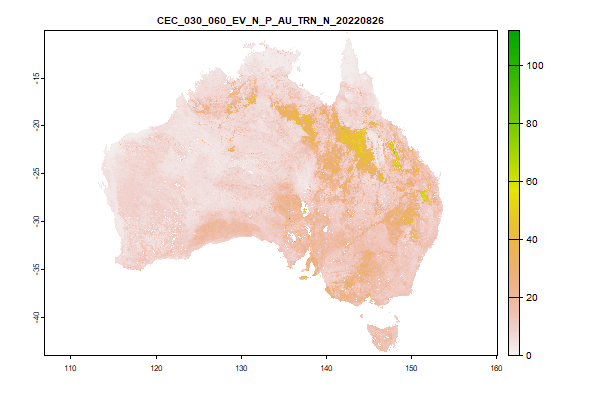
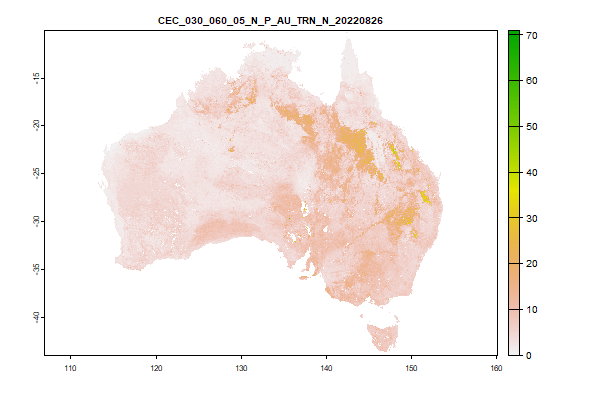
546.6 Mb | CEC_030_060_EV_N_P_AU_TRN_N_20220826.tif | The Modelled-Value for Cation Exchange Capacity (meq/100g) at 0.3 to 0.6 metres |
 Click to enlarge the image
|
|
556.8 Mb | CEC_060_100_EV_N_P_AU_TRN_N_20220826.tif | The Modelled-Value for Cation Exchange Capacity (meq/100g) at 0.6 to 1 metres |
 Click to enlarge the image
|
|
565.9 Mb | CEC_100_200_EV_N_P_AU_TRN_N_20220826.tif | The Modelled-Value for Cation Exchange Capacity (meq/100g) at 1 to 2 metres |
 Click to enlarge the image
|
|
368.5 Mb | CEC_000_005_05_N_P_AU_TRN_N_20220826.tif | The Lower-CI for Cation Exchange Capacity (meq/100g) at 0 to 0.05 metres |
 Click to enlarge the image
|
|
372.7 Mb | CEC_005_015_05_N_P_AU_TRN_N_20220826.tif | The Lower-CI for Cation Exchange Capacity (meq/100g) at 0.05 to 0.15 metres |
 Click to enlarge the image
|
|
387.7 Mb | CEC_015_030_05_N_P_AU_TRN_N_20220826.tif | The Lower-CI for Cation Exchange Capacity (meq/100g) at 0.15 to 0.3 metres |
 Click to enlarge the image
|
|
396.7 Mb | CEC_030_060_05_N_P_AU_TRN_N_20220826.tif | The Lower-CI for Cation Exchange Capacity (meq/100g) at 0.3 to 0.6 metres |
 Click to enlarge the image
|
|
402 Mb | CEC_060_100_05_N_P_AU_TRN_N_20220826.tif | The Lower-CI for Cation Exchange Capacity (meq/100g) at 0.6 to 1 metres |
 Click to enlarge the image
|
|
405.6 Mb | CEC_100_200_05_N_P_AU_TRN_N_20220826.tif | The Lower-CI for Cation Exchange Capacity (meq/100g) at 1 to 2 metres |
 Click to enlarge the image
|
|
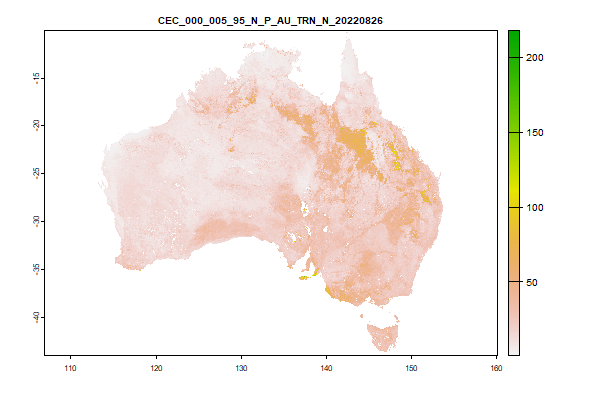
685.5 Mb | CEC_000_005_95_N_P_AU_TRN_N_20220826.tif | The Upper-CI for Cation Exchange Capacity (meq/100g) at 0 to 0.05 metres |
 Click to enlarge the image
|
|
691.7 Mb | CEC_005_015_95_N_P_AU_TRN_N_20220826.tif | The Upper-CI for Cation Exchange Capacity (meq/100g) at 0.05 to 0.15 metres |
 Click to enlarge the image
|
|
714.5 Mb | CEC_015_030_95_N_P_AU_TRN_N_20220826.tif | The Upper-CI for Cation Exchange Capacity (meq/100g) at 0.15 to 0.3 metres |
 Click to enlarge the image
|
|
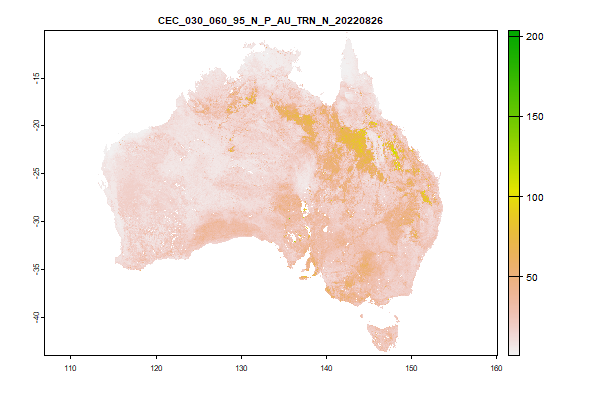
728.5 Mb | CEC_030_060_95_N_P_AU_TRN_N_20220826.tif | The Upper-CI for Cation Exchange Capacity (meq/100g) at 0.3 to 0.6 metres |
 Click to enlarge the image
|
|
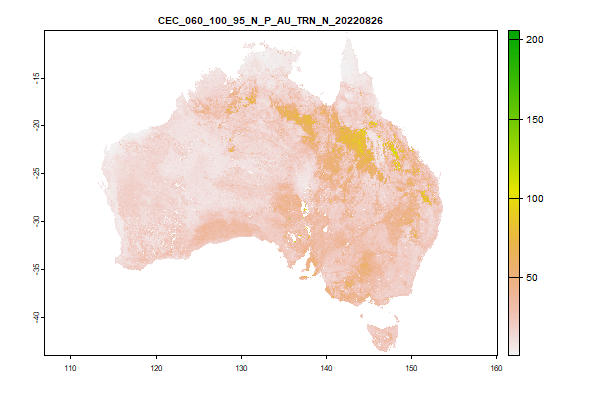
738.3 Mb | CEC_060_100_95_N_P_AU_TRN_N_20220826.tif | The Upper-CI for Cation Exchange Capacity (meq/100g) at 0.6 to 1 metres |
 Click to enlarge the image
|
|
746.3 Mb | CEC_100_200_95_N_P_AU_TRN_N_20220826.tif | The Upper-CI for Cation Exchange Capacity (meq/100g) at 1 to 2 metres |
| Got to the web directory for this product | ||||
 Click to enlarge the image
|
|
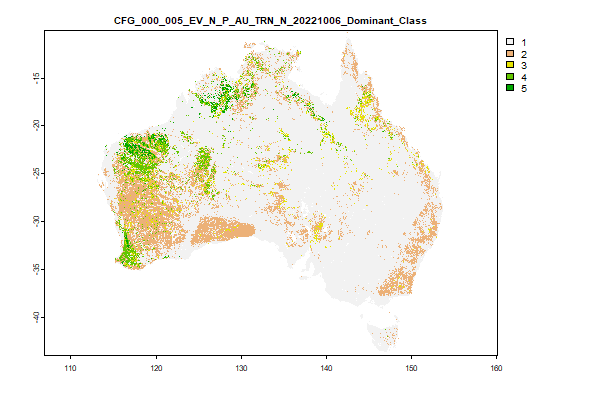
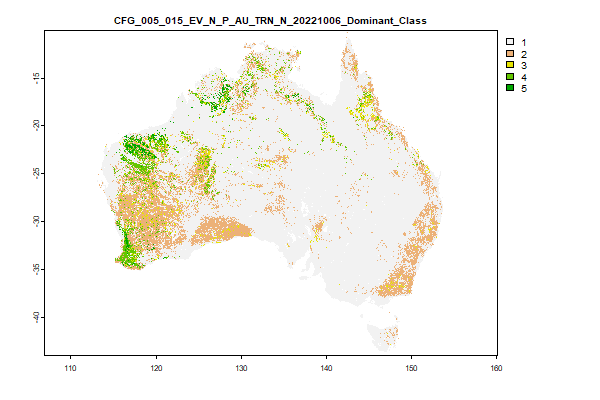
105.1 Mb | CFG_000_005_EV_N_P_AU_TRN_N_20221006_Dominant_Class.tif | The Modelled-Value for Coarse Fragments (None) at 0 to 0.05 metres |
 Click to enlarge the image
|
|
97.7 Mb | CFG_005_015_EV_N_P_AU_TRN_N_20221006_Dominant_Class.tif | The Modelled-Value for Coarse Fragments (None) at 0.05 to 0.15 metres |
 Click to enlarge the image
|
|
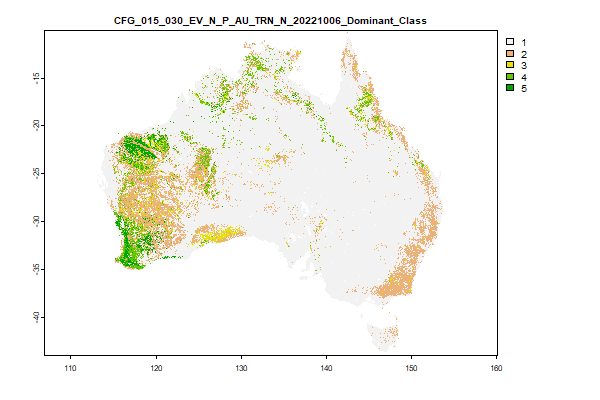
95.2 Mb | CFG_015_030_EV_N_P_AU_TRN_N_20221006_Dominant_Class.tif | The Modelled-Value for Coarse Fragments (None) at 0.15 to 0.3 metres |
| Got to the web directory for this product | ||||
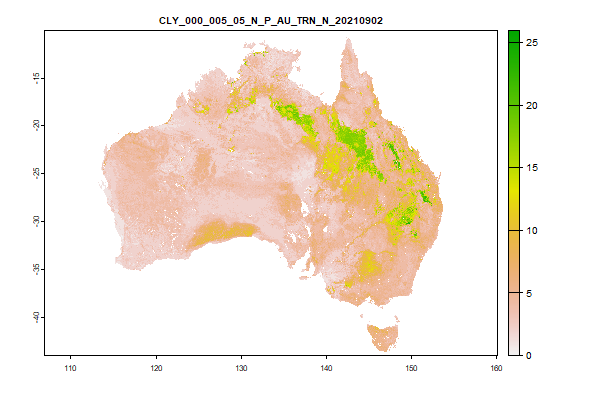
 Click to enlarge the image
|
|
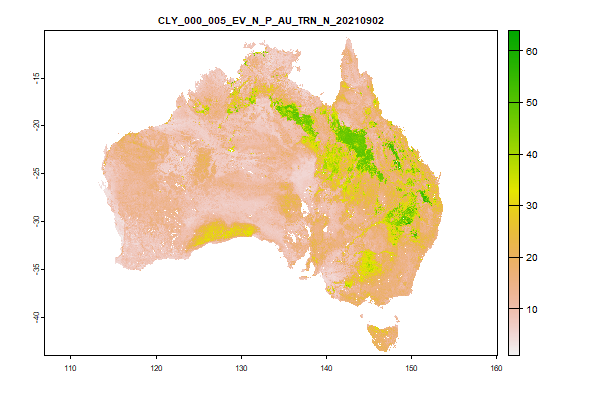
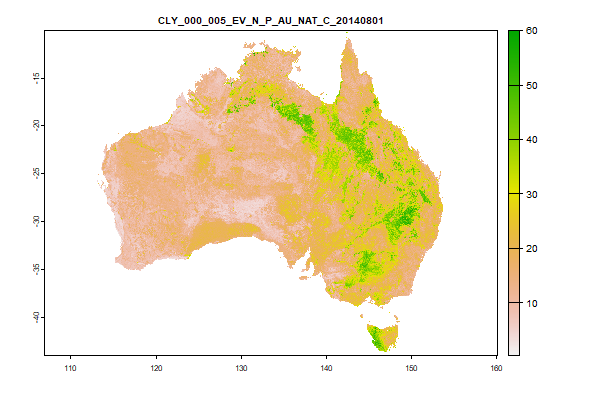
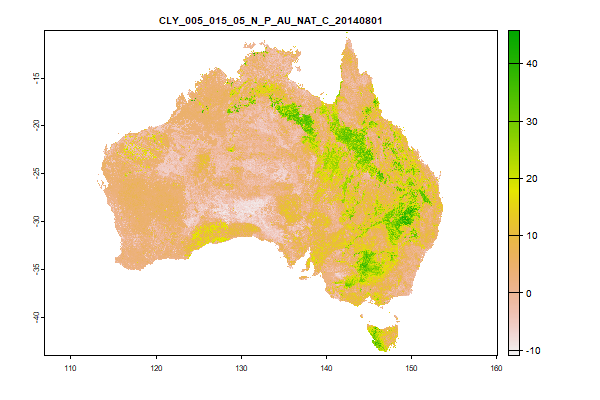
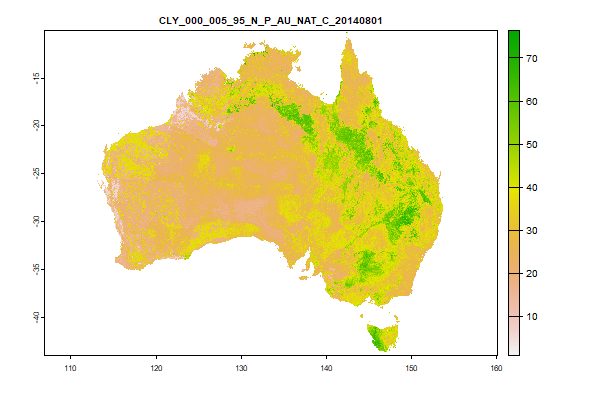
620.9 Mb | CLY_000_005_EV_N_P_AU_TRN_N_20210902.tif | The Modelled-Value for Clay (%) at 0 to 0.05 metres |
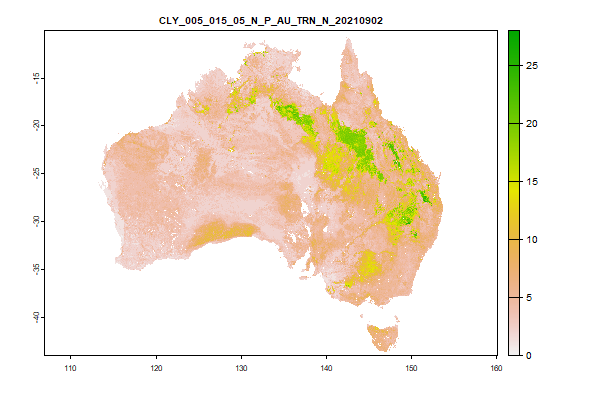
 Click to enlarge the image
|
|
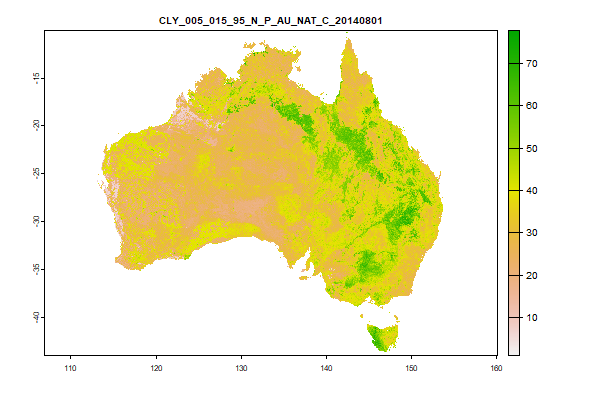
652.1 Mb | CLY_005_015_EV_N_P_AU_TRN_N_20210902.tif | The Modelled-Value for Clay (%) at 0.05 to 0.15 metres |
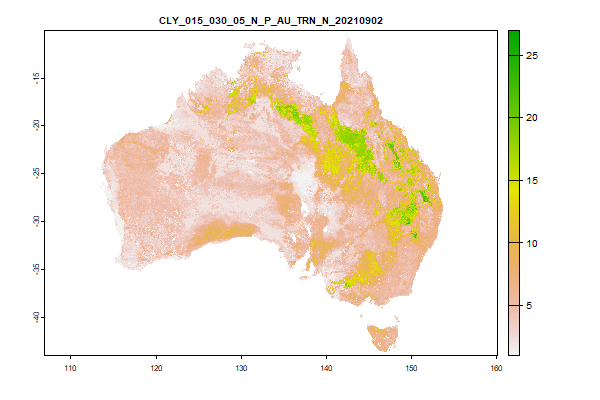
 Click to enlarge the image
|
|
714.8 Mb | CLY_015_030_EV_N_P_AU_TRN_N_20210902.tif | The Modelled-Value for Clay (%) at 0.15 to 0.3 metres |
 Click to enlarge the image
|
|
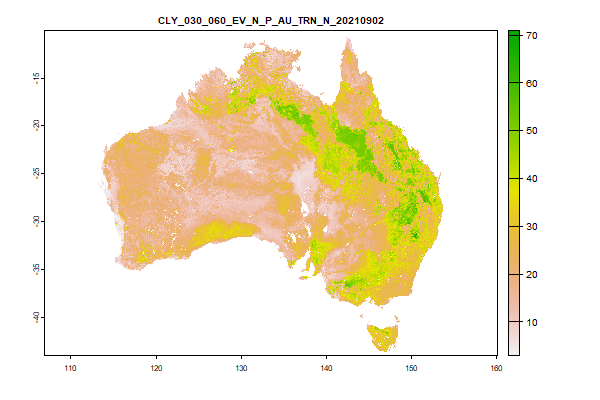
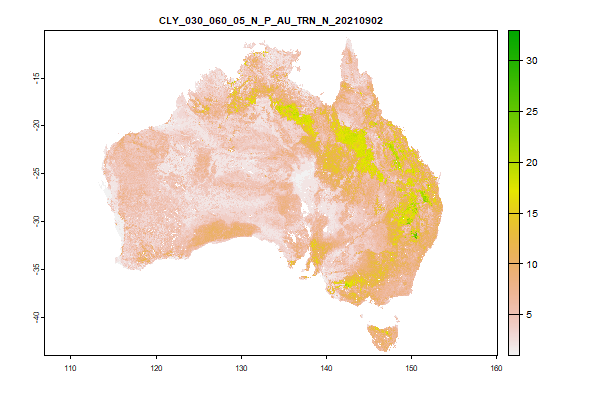
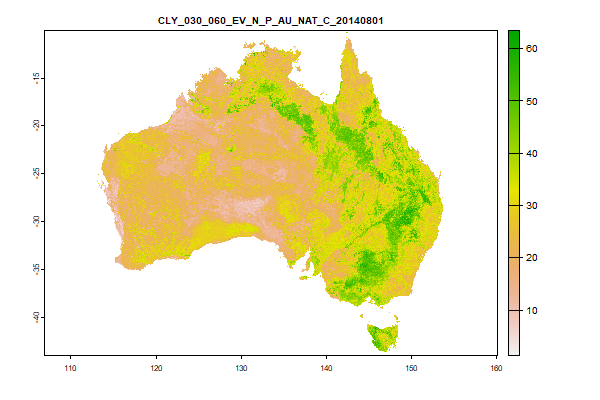
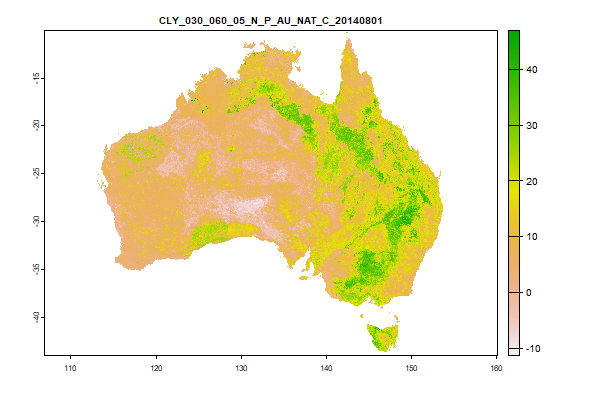
754.5 Mb | CLY_030_060_EV_N_P_AU_TRN_N_20210902.tif | The Modelled-Value for Clay (%) at 0.3 to 0.6 metres |
 Click to enlarge the image
|
|
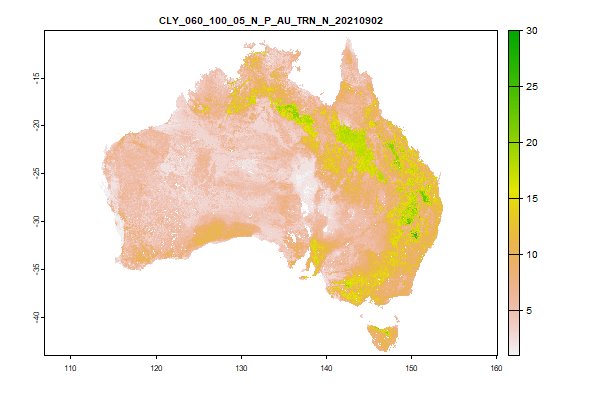
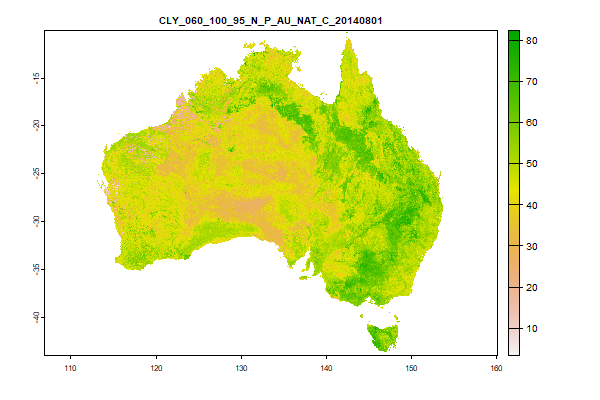
683.4 Mb | CLY_060_100_EV_N_P_AU_TRN_N_20210902.tif | The Modelled-Value for Clay (%) at 0.6 to 1 metres |
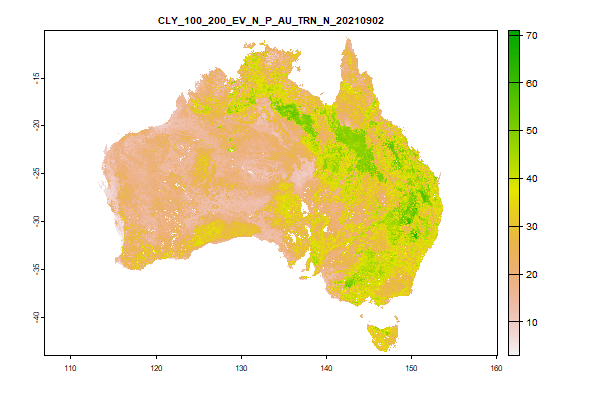 Click to enlarge the image
|
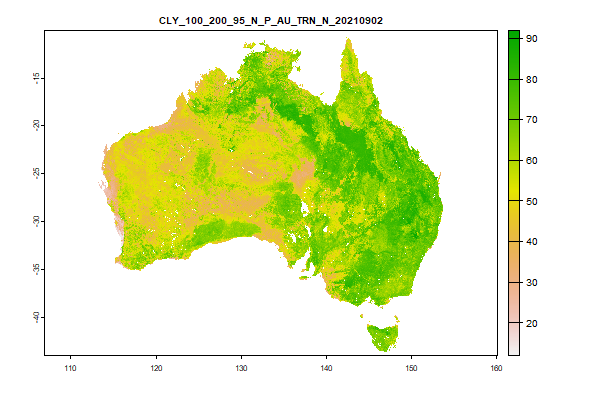
|
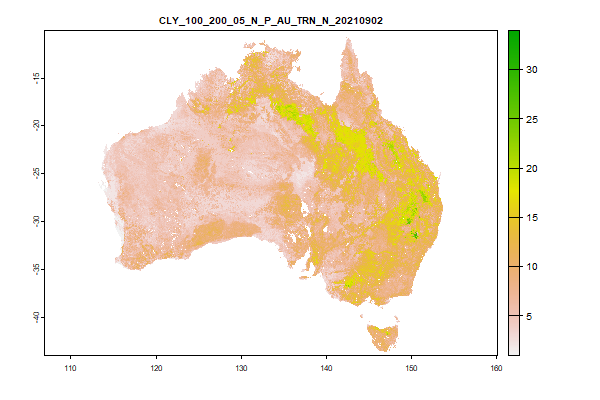
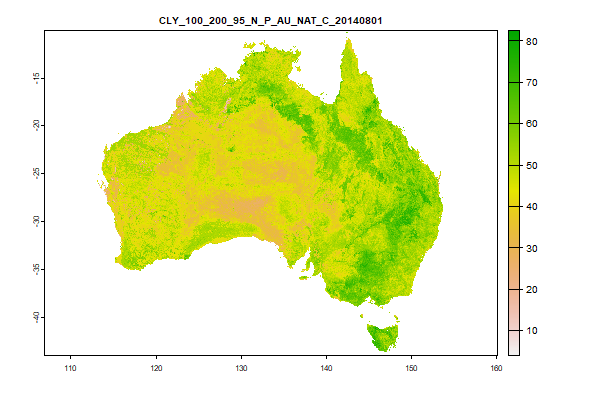
761.7 Mb | CLY_100_200_EV_N_P_AU_TRN_N_20210902.tif | The Modelled-Value for Clay (%) at 1 to 2 metres |
 Click to enlarge the image
|
|
323.2 Mb | CLY_000_005_05_N_P_AU_TRN_N_20210902.tif | The Lower-CI for Clay (%) at 0 to 0.05 metres |
 Click to enlarge the image
|
|
361.2 Mb | CLY_005_015_05_N_P_AU_TRN_N_20210902.tif | The Lower-CI for Clay (%) at 0.05 to 0.15 metres |
 Click to enlarge the image
|
|
384.2 Mb | CLY_015_030_05_N_P_AU_TRN_N_20210902.tif | The Lower-CI for Clay (%) at 0.15 to 0.3 metres |
 Click to enlarge the image
|
|
425 Mb | CLY_030_060_05_N_P_AU_TRN_N_20210902.tif | The Lower-CI for Clay (%) at 0.3 to 0.6 metres |
 Click to enlarge the image
|
|
384 Mb | CLY_060_100_05_N_P_AU_TRN_N_20210902.tif | The Lower-CI for Clay (%) at 0.6 to 1 metres |
 Click to enlarge the image
|
|
468.8 Mb | CLY_100_200_05_N_P_AU_TRN_N_20210902.tif | The Lower-CI for Clay (%) at 1 to 2 metres |
 Click to enlarge the image
|
|
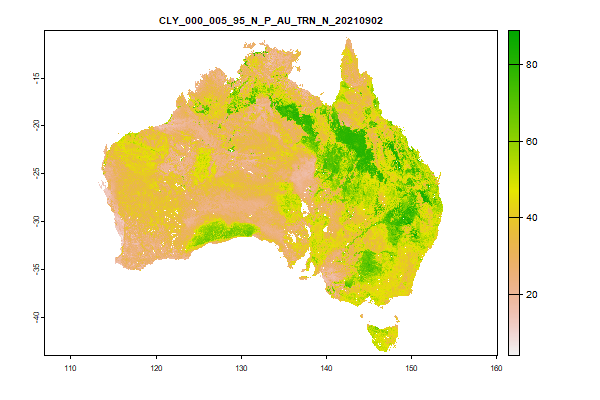
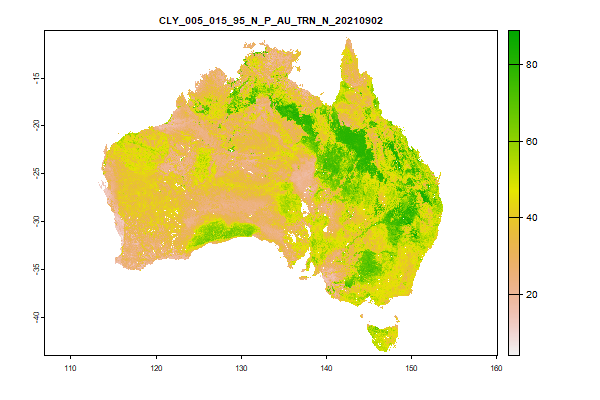
812.4 Mb | CLY_000_005_95_N_P_AU_TRN_N_20210902.tif | The Upper-CI for Clay (%) at 0 to 0.05 metres |
 Click to enlarge the image
|
|
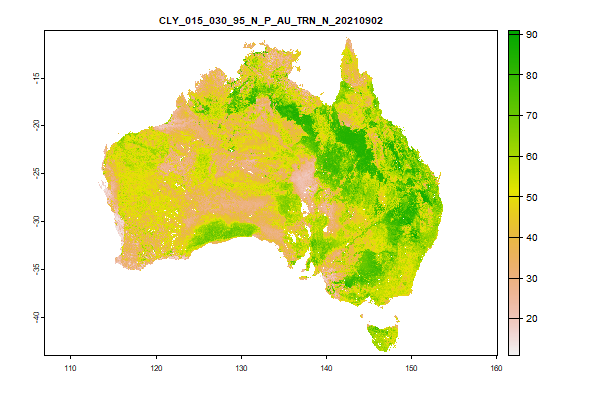
825.6 Mb | CLY_005_015_95_N_P_AU_TRN_N_20210902.tif | The Upper-CI for Clay (%) at 0.05 to 0.15 metres |
 Click to enlarge the image
|
|
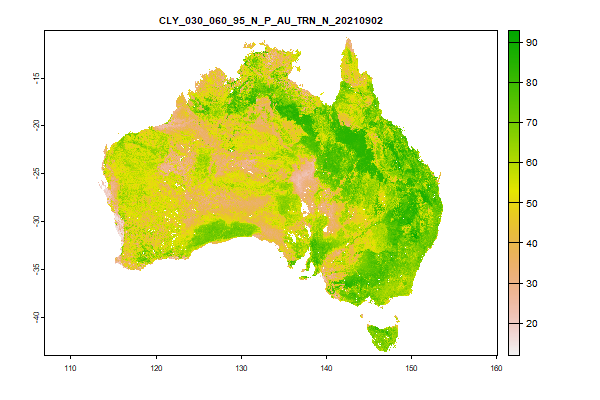
856.2 Mb | CLY_015_030_95_N_P_AU_TRN_N_20210902.tif | The Upper-CI for Clay (%) at 0.15 to 0.3 metres |
 Click to enlarge the image
|
|
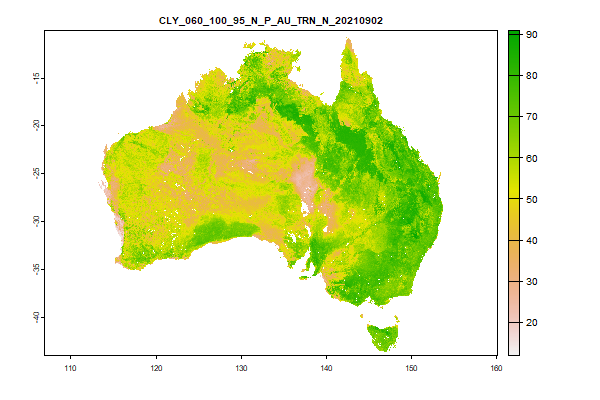
854 Mb | CLY_030_060_95_N_P_AU_TRN_N_20210902.tif | The Upper-CI for Clay (%) at 0.3 to 0.6 metres |
 Click to enlarge the image
|
|
765.4 Mb | CLY_060_100_95_N_P_AU_TRN_N_20210902.tif | The Upper-CI for Clay (%) at 0.6 to 1 metres |
 Click to enlarge the image
|
|
823.1 Mb | CLY_100_200_95_N_P_AU_TRN_N_20210902.tif | The Upper-CI for Clay (%) at 1 to 2 metres |
| Got to the web directory for this product | ||||
 Click to enlarge the image
|
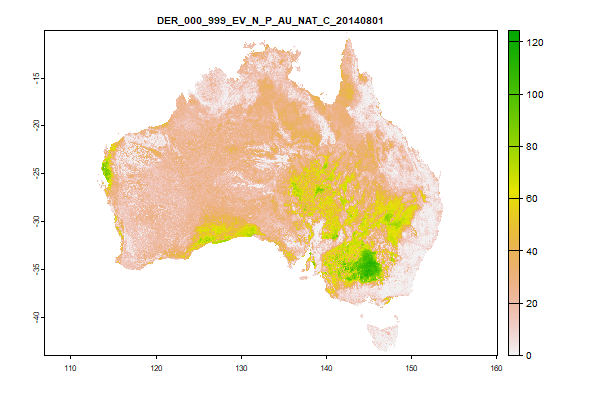
|
3.8 Gb | DER_000_999_EV_N_P_AU_NAT_C_20140801.tif | The Modelled-Value for Depth of Regolith (m) at 0 to 99.99 metres |
 Click to enlarge the image
|
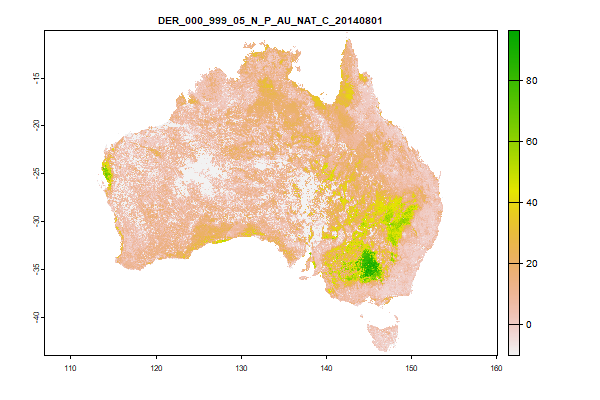
|
3.8 Gb | DER_000_999_05_N_P_AU_NAT_C_20140801.tif | The Lower-CI for Depth of Regolith (m) at 0 to 99.99 metres |
 Click to enlarge the image
|
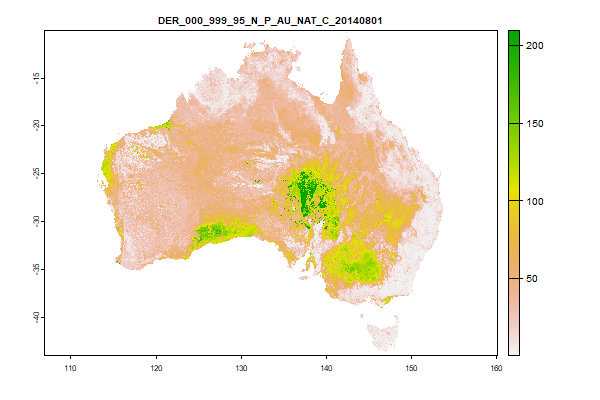
|
3.8 Gb | DER_000_999_95_N_P_AU_NAT_C_20140801.tif | The Upper-CI for Depth of Regolith (m) at 0 to 99.99 metres |
| Got to the web directory for this product | ||||
 Click to enlarge the image
|
|
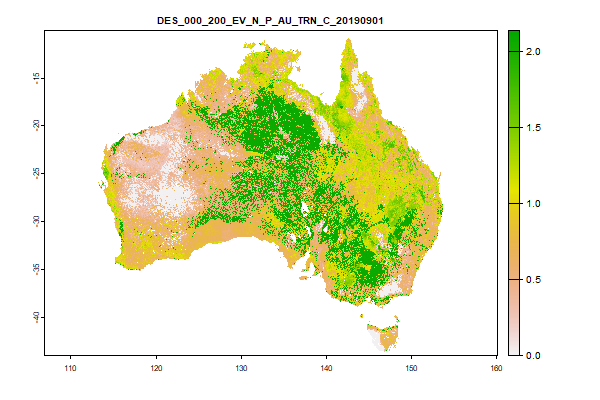
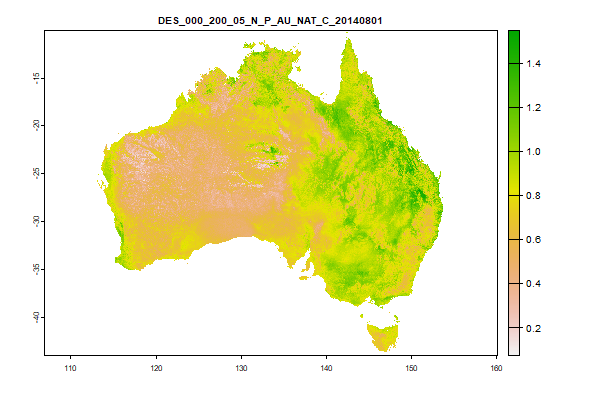
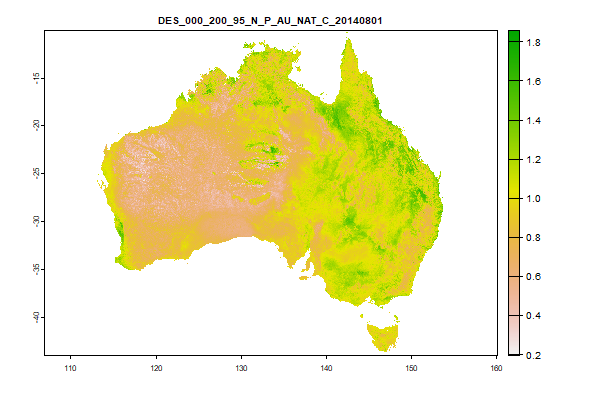
1.1 Gb | DES_000_200_EV_N_P_AU_TRN_C_20190901.tif | The Modelled-Value for Depth of Soil (m) at 0 to 2 metres |
| Got to the web directory for this product | ||||
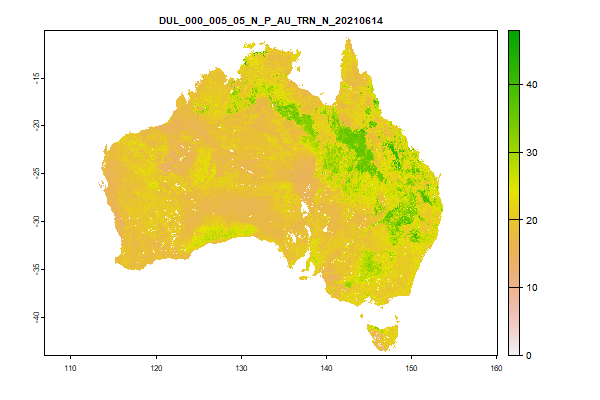
 Click to enlarge the image
|
|
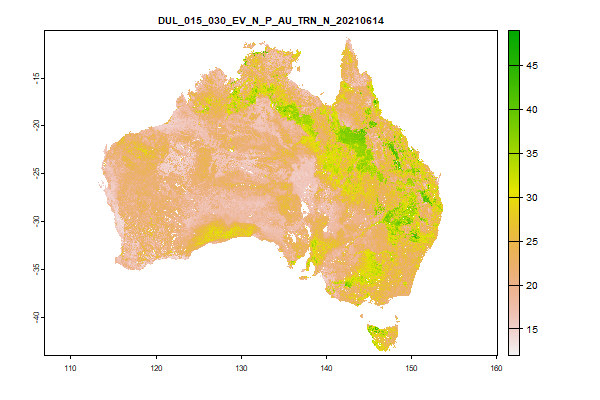
471.4 Mb | DUL_000_005_EV_N_P_AU_TRN_N_20210614.tif | The Modelled-Value for Drained Upper Limit (%) at 0 to 0.05 metres |
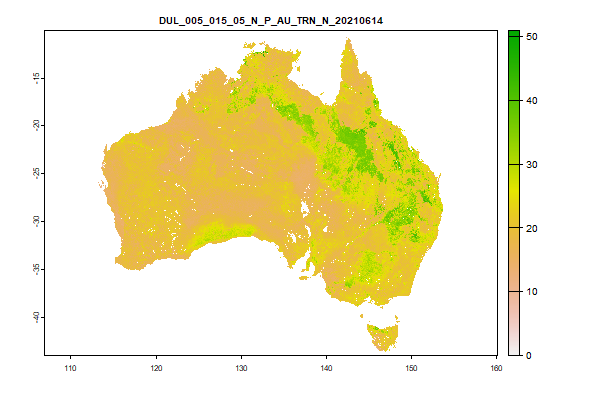
 Click to enlarge the image
|
|
469.5 Mb | DUL_005_015_EV_N_P_AU_TRN_N_20210614.tif | The Modelled-Value for Drained Upper Limit (%) at 0.05 to 0.15 metres |
 Click to enlarge the image
|
|
487.3 Mb | DUL_015_030_EV_N_P_AU_TRN_N_20210614.tif | The Modelled-Value for Drained Upper Limit (%) at 0.15 to 0.3 metres |
 Click to enlarge the image
|
|
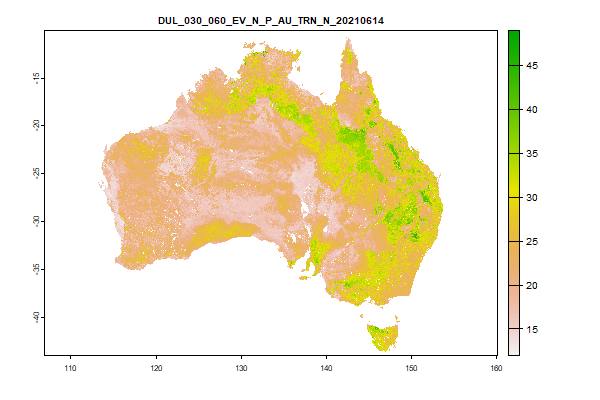
503.5 Mb | DUL_030_060_EV_N_P_AU_TRN_N_20210614.tif | The Modelled-Value for Drained Upper Limit (%) at 0.3 to 0.6 metres |
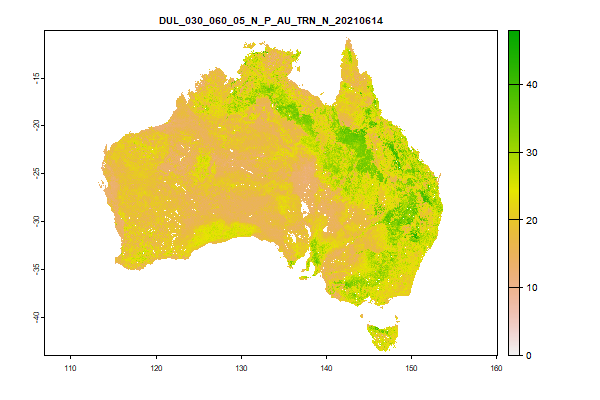
 Click to enlarge the image
|
|
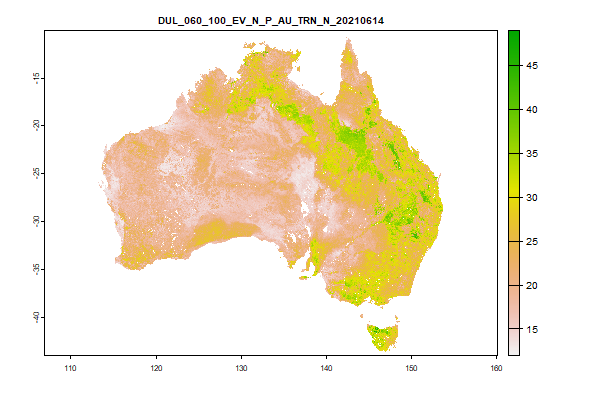
472.8 Mb | DUL_060_100_EV_N_P_AU_TRN_N_20210614.tif | The Modelled-Value for Drained Upper Limit (%) at 0.6 to 1 metres |
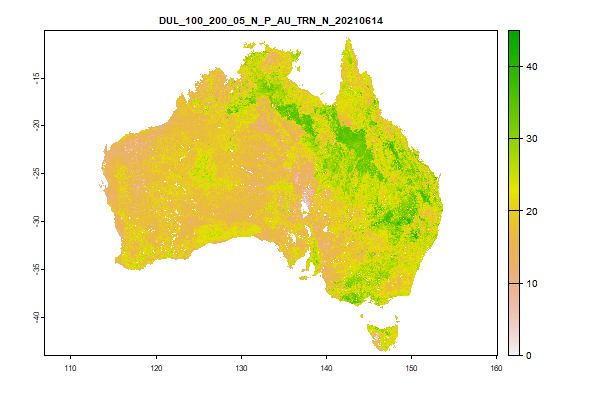
 Click to enlarge the image
|
|
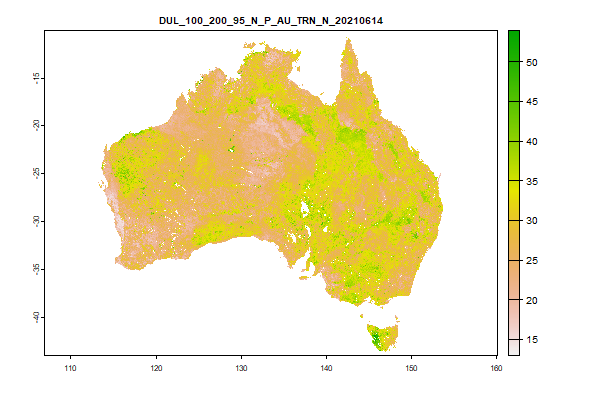
530.9 Mb | DUL_100_200_EV_N_P_AU_TRN_N_20210614.tif | The Modelled-Value for Drained Upper Limit (%) at 1 to 2 metres |
 Click to enlarge the image
|
|
480.2 Mb | DUL_000_005_05_N_P_AU_TRN_N_20210614.tif | The Lower-CI for Drained Upper Limit (%) at 0 to 0.05 metres |
 Click to enlarge the image
|
|
478.3 Mb | DUL_005_015_05_N_P_AU_TRN_N_20210614.tif | The Lower-CI for Drained Upper Limit (%) at 0.05 to 0.15 metres |
 Click to enlarge the image
|
|
501.1 Mb | DUL_015_030_05_N_P_AU_TRN_N_20210614.tif | The Lower-CI for Drained Upper Limit (%) at 0.15 to 0.3 metres |
 Click to enlarge the image
|
|
513.8 Mb | DUL_030_060_05_N_P_AU_TRN_N_20210614.tif | The Lower-CI for Drained Upper Limit (%) at 0.3 to 0.6 metres |
 Click to enlarge the image
|
|
491.6 Mb | DUL_060_100_05_N_P_AU_TRN_N_20210614.tif | The Lower-CI for Drained Upper Limit (%) at 0.6 to 1 metres |
 Click to enlarge the image
|
|
607.9 Mb | DUL_100_200_05_N_P_AU_TRN_N_20210614.tif | The Lower-CI for Drained Upper Limit (%) at 1 to 2 metres |
 Click to enlarge the image
|
|
526.3 Mb | DUL_000_005_95_N_P_AU_TRN_N_20210614.tif | The Upper-CI for Drained Upper Limit (%) at 0 to 0.05 metres |
 Click to enlarge the image
|
|
525.9 Mb | DUL_005_015_95_N_P_AU_TRN_N_20210614.tif | The Upper-CI for Drained Upper Limit (%) at 0.05 to 0.15 metres |
 Click to enlarge the image
|
|
532 Mb | DUL_015_030_95_N_P_AU_TRN_N_20210614.tif | The Upper-CI for Drained Upper Limit (%) at 0.15 to 0.3 metres |
 Click to enlarge the image
|
|
543.5 Mb | DUL_030_060_95_N_P_AU_TRN_N_20210614.tif | The Upper-CI for Drained Upper Limit (%) at 0.3 to 0.6 metres |
 Click to enlarge the image
|
|
523.8 Mb | DUL_060_100_95_N_P_AU_TRN_N_20210614.tif | The Upper-CI for Drained Upper Limit (%) at 0.6 to 1 metres |
 Click to enlarge the image
|
|
606.9 Mb | DUL_100_200_95_N_P_AU_TRN_N_20210614.tif | The Upper-CI for Drained Upper Limit (%) at 1 to 2 metres |
| Got to the web directory for this product | ||||
 Click to enlarge the image
|
|
3.8 Gb | ECE_000_005_EV_N_P_AU_NAT_C_20140801.tif | The Modelled-Value for Effective Cation Exchange Capacity (meq/100g) at 0 to 0.05 metres |
 Click to enlarge the image
|
|
3.8 Gb | ECE_005_015_EV_N_P_AU_NAT_C_20140801.tif | The Modelled-Value for Effective Cation Exchange Capacity (meq/100g) at 0.05 to 0.15 metres |
 Click to enlarge the image
|
|
3.8 Gb | ECE_015_030_EV_N_P_AU_NAT_C_20140801.tif | The Modelled-Value for Effective Cation Exchange Capacity (meq/100g) at 0.15 to 0.3 metres |
 Click to enlarge the image
|
|
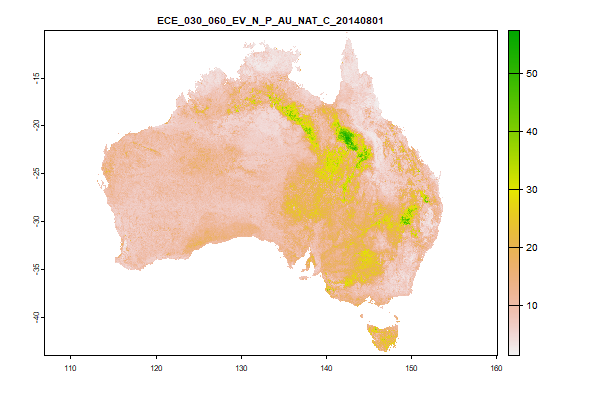
3.8 Gb | ECE_030_060_EV_N_P_AU_NAT_C_20140801.tif | The Modelled-Value for Effective Cation Exchange Capacity (meq/100g) at 0.3 to 0.6 metres |
 Click to enlarge the image
|
|
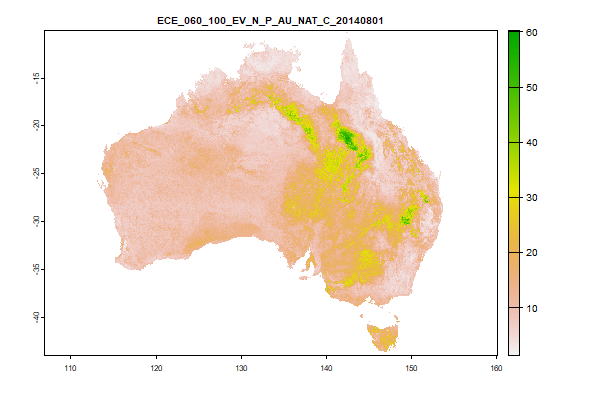
3.8 Gb | ECE_060_100_EV_N_P_AU_NAT_C_20140801.tif | The Modelled-Value for Effective Cation Exchange Capacity (meq/100g) at 0.6 to 1 metres |
 Click to enlarge the image
|
|
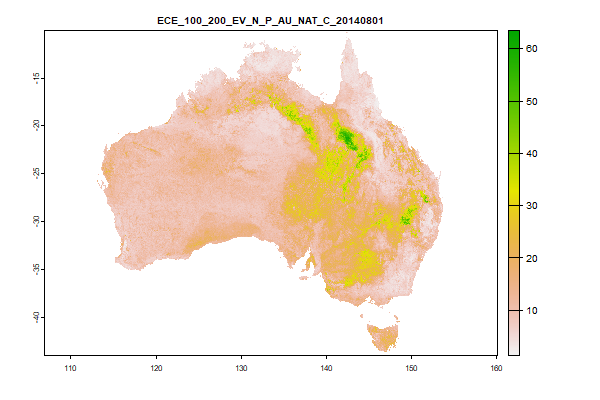
3.8 Gb | ECE_100_200_EV_N_P_AU_NAT_C_20140801.tif | The Modelled-Value for Effective Cation Exchange Capacity (meq/100g) at 1 to 2 metres |
 Click to enlarge the image
|
|
3.8 Gb | ECE_000_005_05_N_P_AU_NAT_C_20140801.tif | The Lower-CI for Effective Cation Exchange Capacity (meq/100g) at 0 to 0.05 metres |
 Click to enlarge the image
|
|
3.8 Gb | ECE_005_015_05_N_P_AU_NAT_C_20140801.tif | The Lower-CI for Effective Cation Exchange Capacity (meq/100g) at 0.05 to 0.15 metres |
 Click to enlarge the image
|
|
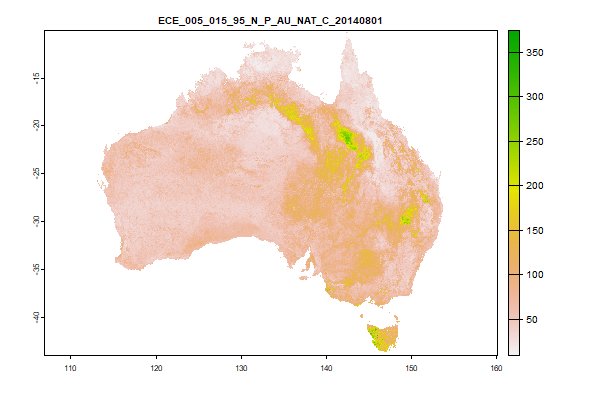
3.8 Gb | ECE_015_030_05_N_P_AU_NAT_C_20140801.tif | The Lower-CI for Effective Cation Exchange Capacity (meq/100g) at 0.15 to 0.3 metres |
 Click to enlarge the image
|
|
3.8 Gb | ECE_030_060_05_N_P_AU_NAT_C_20140801.tif | The Lower-CI for Effective Cation Exchange Capacity (meq/100g) at 0.3 to 0.6 metres |
 Click to enlarge the image
|
|
3.8 Gb | ECE_060_100_05_N_P_AU_NAT_C_20140801.tif | The Lower-CI for Effective Cation Exchange Capacity (meq/100g) at 0.6 to 1 metres |
 Click to enlarge the image
|
|
3.8 Gb | ECE_100_200_05_N_P_AU_NAT_C_20140801.tif | The Lower-CI for Effective Cation Exchange Capacity (meq/100g) at 1 to 2 metres |
 Click to enlarge the image
|
|
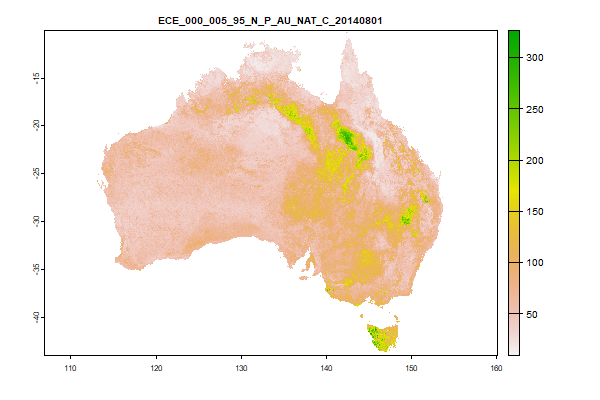
3.8 Gb | ECE_000_005_95_N_P_AU_NAT_C_20140801.tif | The Upper-CI for Effective Cation Exchange Capacity (meq/100g) at 0 to 0.05 metres |
 Click to enlarge the image
|
|
3.8 Gb | ECE_005_015_95_N_P_AU_NAT_C_20140801.tif | The Upper-CI for Effective Cation Exchange Capacity (meq/100g) at 0.05 to 0.15 metres |
 Click to enlarge the image
|
|
3.8 Gb | ECE_015_030_95_N_P_AU_NAT_C_20140801.tif | The Upper-CI for Effective Cation Exchange Capacity (meq/100g) at 0.15 to 0.3 metres |
 Click to enlarge the image
|
|
3.8 Gb | ECE_030_060_95_N_P_AU_NAT_C_20140801.tif | The Upper-CI for Effective Cation Exchange Capacity (meq/100g) at 0.3 to 0.6 metres |
 Click to enlarge the image
|
|
3.8 Gb | ECE_060_100_95_N_P_AU_NAT_C_20140801.tif | The Upper-CI for Effective Cation Exchange Capacity (meq/100g) at 0.6 to 1 metres |
 Click to enlarge the image
|
|
3.8 Gb | ECE_100_200_95_N_P_AU_NAT_C_20140801.tif | The Upper-CI for Effective Cation Exchange Capacity (meq/100g) at 1 to 2 metres |
| Got to the web directory for this product | ||||
 Click to enlarge the image
|
|
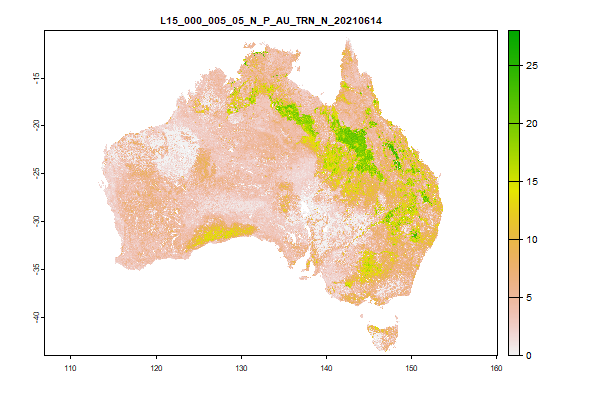
448.2 Mb | L15_000_005_EV_N_P_AU_TRN_N_20210614.tif | The Modelled-Value for Lower Limit (%) at 0 to 0.05 metres |
 Click to enlarge the image
|
|
450.9 Mb | L15_005_015_EV_N_P_AU_TRN_N_20210614.tif | The Modelled-Value for Lower Limit (%) at 0.05 to 0.15 metres |
 Click to enlarge the image
|
|
469.9 Mb | L15_015_030_EV_N_P_AU_TRN_N_20210614.tif | The Modelled-Value for Lower Limit (%) at 0.15 to 0.3 metres |
 Click to enlarge the image
|
|
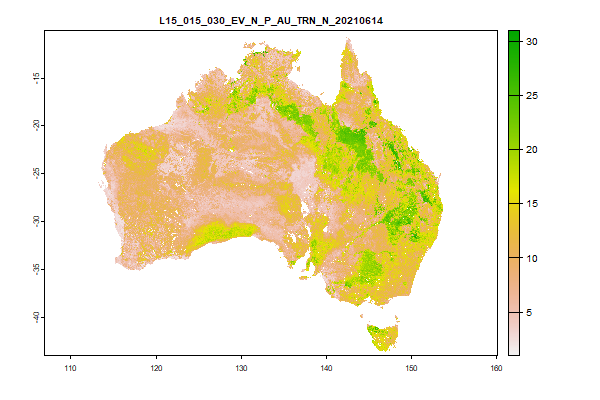
487 Mb | L15_030_060_EV_N_P_AU_TRN_N_20210614.tif | The Modelled-Value for Lower Limit (%) at 0.3 to 0.6 metres |
 Click to enlarge the image
|
|
457.4 Mb | L15_060_100_EV_N_P_AU_TRN_N_20210614.tif | The Modelled-Value for Lower Limit (%) at 0.6 to 1 metres |
 Click to enlarge the image
|
|
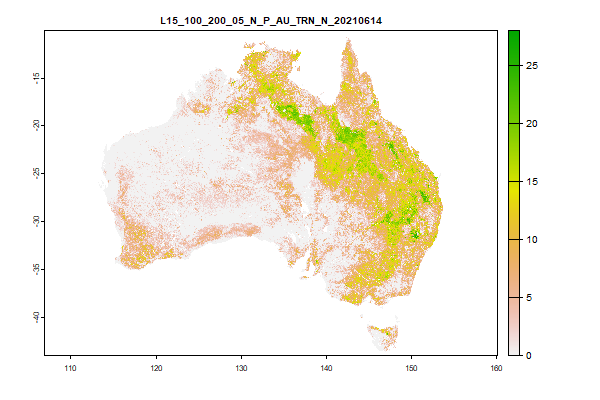
505.3 Mb | L15_100_200_EV_N_P_AU_TRN_N_20210614.tif | The Modelled-Value for Lower Limit (%) at 1 to 2 metres |
 Click to enlarge the image
|
|
486.6 Mb | L15_000_005_05_N_P_AU_TRN_N_20210614.tif | The Lower-CI for Lower Limit (%) at 0 to 0.05 metres |
 Click to enlarge the image
|
|
493.5 Mb | L15_005_015_05_N_P_AU_TRN_N_20210614.tif | The Lower-CI for Lower Limit (%) at 0.05 to 0.15 metres |
 Click to enlarge the image
|
|
521.7 Mb | L15_015_030_05_N_P_AU_TRN_N_20210614.tif | The Lower-CI for Lower Limit (%) at 0.15 to 0.3 metres |
 Click to enlarge the image
|
|
537 Mb | L15_030_060_05_N_P_AU_TRN_N_20210614.tif | The Lower-CI for Lower Limit (%) at 0.3 to 0.6 metres |
 Click to enlarge the image
|
|
527.4 Mb | L15_060_100_05_N_P_AU_TRN_N_20210614.tif | The Lower-CI for Lower Limit (%) at 0.6 to 1 metres |
 Click to enlarge the image
|
|
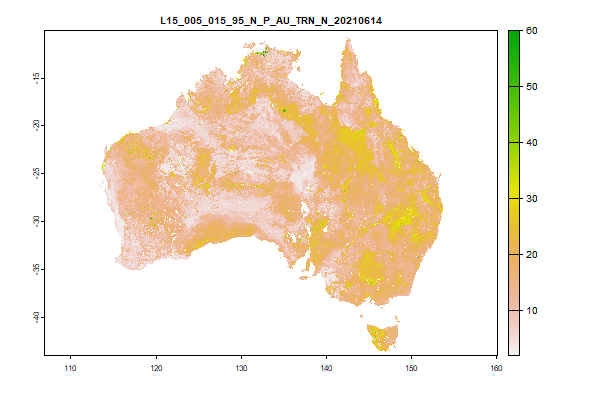
463.4 Mb | L15_100_200_05_N_P_AU_TRN_N_20210614.tif | The Lower-CI for Lower Limit (%) at 1 to 2 metres |
 Click to enlarge the image
|
|
604.6 Mb | L15_000_005_95_N_P_AU_TRN_N_20210614.tif | The Upper-CI for Lower Limit (%) at 0 to 0.05 metres |
 Click to enlarge the image
|
|
618 Mb | L15_005_015_95_N_P_AU_TRN_N_20210614.tif | The Upper-CI for Lower Limit (%) at 0.05 to 0.15 metres |
 Click to enlarge the image
|
|
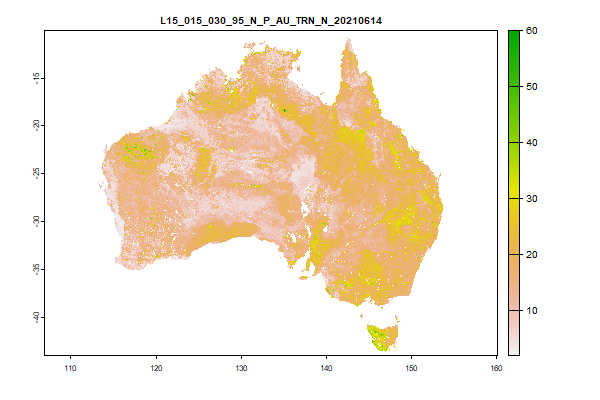
628.8 Mb | L15_015_030_95_N_P_AU_TRN_N_20210614.tif | The Upper-CI for Lower Limit (%) at 0.15 to 0.3 metres |
 Click to enlarge the image
|
|
625.9 Mb | L15_030_060_95_N_P_AU_TRN_N_20210614.tif | The Upper-CI for Lower Limit (%) at 0.3 to 0.6 metres |
 Click to enlarge the image
|
|
626.7 Mb | L15_060_100_95_N_P_AU_TRN_N_20210614.tif | The Upper-CI for Lower Limit (%) at 0.6 to 1 metres |
 Click to enlarge the image
|
|
745.6 Mb | L15_100_200_95_N_P_AU_TRN_N_20210614.tif | The Upper-CI for Lower Limit (%) at 1 to 2 metres |
| Got to the web directory for this product | ||||
 Click to enlarge the image
|
|
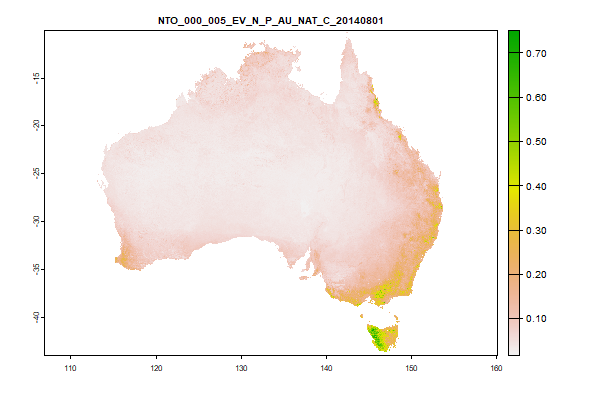
3.7 Gb | NTO_000_005_EV_N_P_AU_NAT_C_20140801.tif | The Modelled-Value for Total Nitrogen (%) at 0 to 0.05 metres |
 Click to enlarge the image
|
|
3.8 Gb | NTO_005_015_EV_N_P_AU_NAT_C_20140801.tif | The Modelled-Value for Total Nitrogen (%) at 0.05 to 0.15 metres |
 Click to enlarge the image
|
|
3.8 Gb | NTO_015_030_EV_N_P_AU_NAT_C_20140801.tif | The Modelled-Value for Total Nitrogen (%) at 0.15 to 0.3 metres |
 Click to enlarge the image
|
|
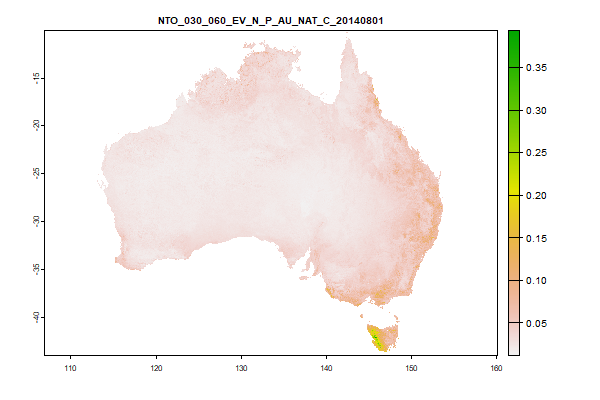
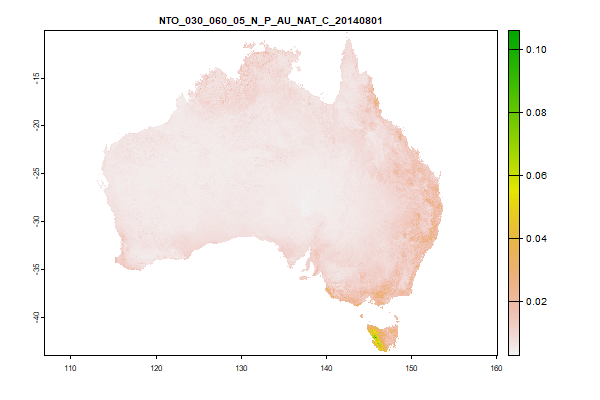
3.7 Gb | NTO_030_060_EV_N_P_AU_NAT_C_20140801.tif | The Modelled-Value for Total Nitrogen (%) at 0.3 to 0.6 metres |
 Click to enlarge the image
|
|
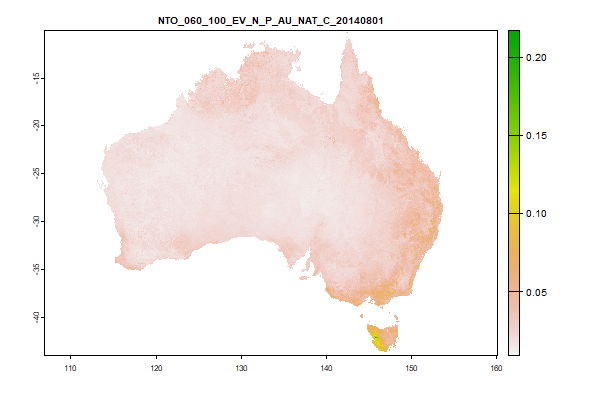
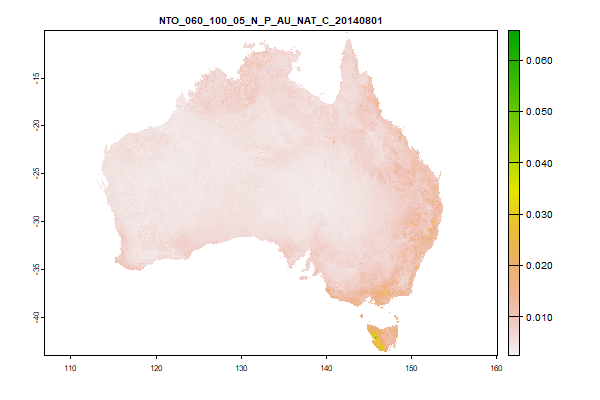
3.7 Gb | NTO_060_100_EV_N_P_AU_NAT_C_20140801.tif | The Modelled-Value for Total Nitrogen (%) at 0.6 to 1 metres |
 Click to enlarge the image
|
|
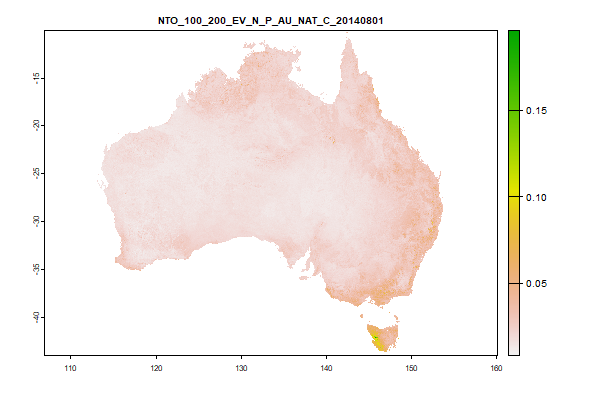
3.7 Gb | NTO_100_200_EV_N_P_AU_NAT_C_20140801.tif | The Modelled-Value for Total Nitrogen (%) at 1 to 2 metres |
 Click to enlarge the image
|
|
3.7 Gb | NTO_000_005_05_N_P_AU_NAT_C_20140801.tif | The Lower-CI for Total Nitrogen (%) at 0 to 0.05 metres |
 Click to enlarge the image
|
|
3.8 Gb | NTO_005_015_05_N_P_AU_NAT_C_20140801.tif | The Lower-CI for Total Nitrogen (%) at 0.05 to 0.15 metres |
 Click to enlarge the image
|
|
3.8 Gb | NTO_015_030_05_N_P_AU_NAT_C_20140801.tif | The Lower-CI for Total Nitrogen (%) at 0.15 to 0.3 metres |
 Click to enlarge the image
|
|
3.7 Gb | NTO_030_060_05_N_P_AU_NAT_C_20140801.tif | The Lower-CI for Total Nitrogen (%) at 0.3 to 0.6 metres |
 Click to enlarge the image
|
|
3.7 Gb | NTO_060_100_05_N_P_AU_NAT_C_20140801.tif | The Lower-CI for Total Nitrogen (%) at 0.6 to 1 metres |
 Click to enlarge the image
|
|
3.7 Gb | NTO_100_200_05_N_P_AU_NAT_C_20140801.tif | The Lower-CI for Total Nitrogen (%) at 1 to 2 metres |
 Click to enlarge the image
|
|
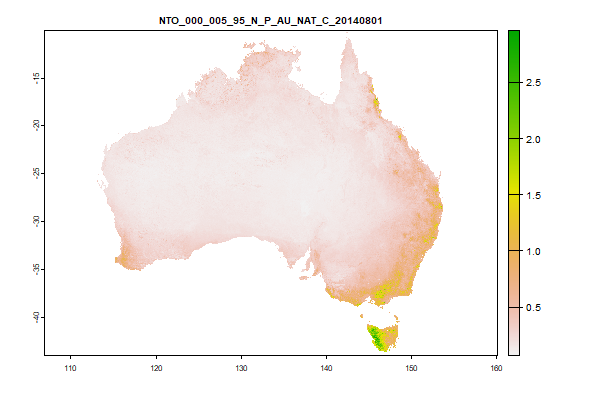
3.8 Gb | NTO_000_005_95_N_P_AU_NAT_C_20140801.tif | The Upper-CI for Total Nitrogen (%) at 0 to 0.05 metres |
 Click to enlarge the image
|
|
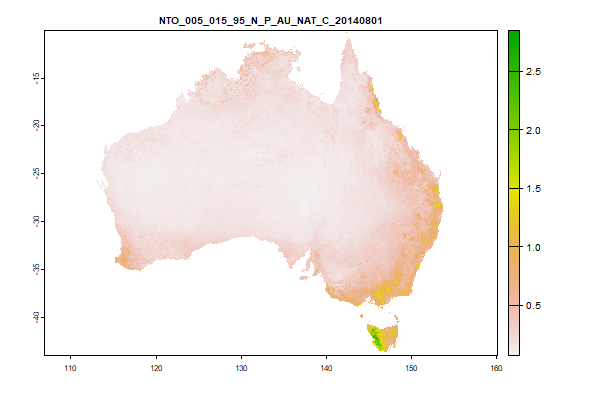
3.8 Gb | NTO_005_015_95_N_P_AU_NAT_C_20140801.tif | The Upper-CI for Total Nitrogen (%) at 0.05 to 0.15 metres |
 Click to enlarge the image
|
|
3.8 Gb | NTO_015_030_95_N_P_AU_NAT_C_20140801.tif | The Upper-CI for Total Nitrogen (%) at 0.15 to 0.3 metres |
 Click to enlarge the image
|
|
3.7 Gb | NTO_030_060_95_N_P_AU_NAT_C_20140801.tif | The Upper-CI for Total Nitrogen (%) at 0.3 to 0.6 metres |
 Click to enlarge the image
|
|
3.7 Gb | NTO_060_100_95_N_P_AU_NAT_C_20140801.tif | The Upper-CI for Total Nitrogen (%) at 0.6 to 1 metres |
 Click to enlarge the image
|
|
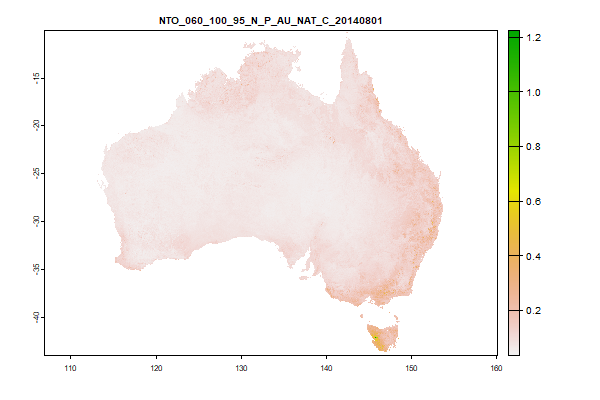
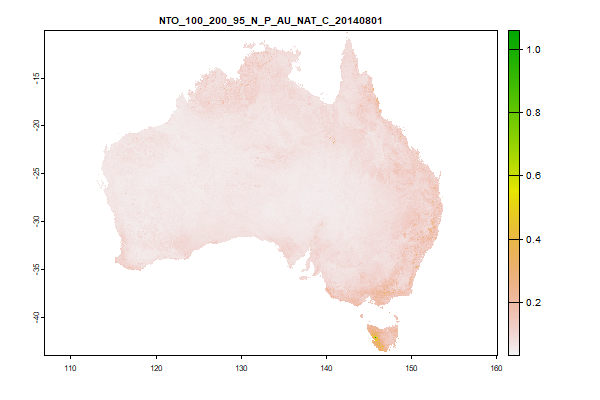
3.7 Gb | NTO_100_200_95_N_P_AU_NAT_C_20140801.tif | The Upper-CI for Total Nitrogen (%) at 1 to 2 metres |
| Got to the web directory for this product | ||||
 Click to enlarge the image
|
|
3.4 Gb | pHc_000_005_EV_N_P_AU_NAT_C_20140801.tif | The Modelled-Value for pH CaCl2 (None) at 0 to 0.05 metres |
 Click to enlarge the image
|
|
3.4 Gb | pHc_005_015_EV_N_P_AU_NAT_C_20140801.tif | The Modelled-Value for pH CaCl2 (None) at 0.05 to 0.15 metres |
 Click to enlarge the image
|
|
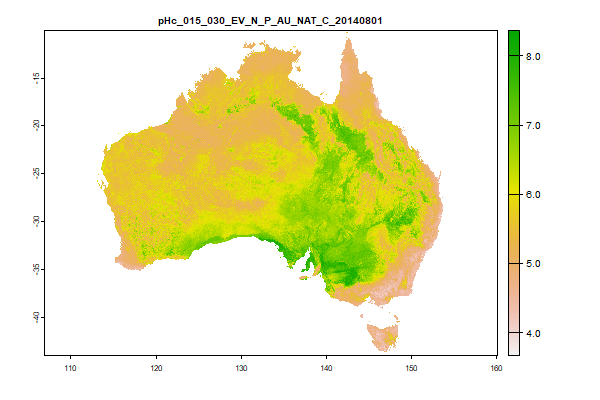
3.4 Gb | pHc_015_030_EV_N_P_AU_NAT_C_20140801.tif | The Modelled-Value for pH CaCl2 (None) at 0.15 to 0.3 metres |
 Click to enlarge the image
|
|
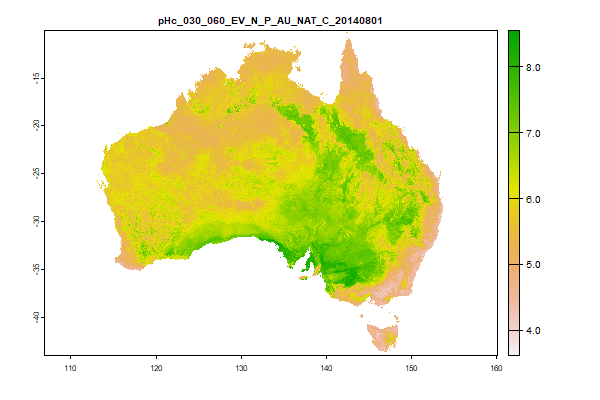
3.4 Gb | pHc_030_060_EV_N_P_AU_NAT_C_20140801.tif | The Modelled-Value for pH CaCl2 (None) at 0.3 to 0.6 metres |
 Click to enlarge the image
|
|
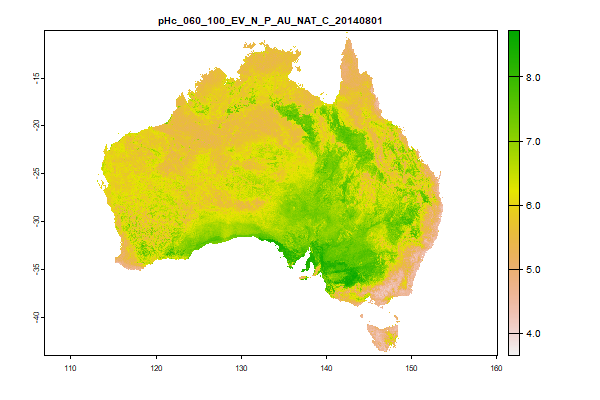
3.4 Gb | pHc_060_100_EV_N_P_AU_NAT_C_20140801.tif | The Modelled-Value for pH CaCl2 (None) at 0.6 to 1 metres |
 Click to enlarge the image
|
|
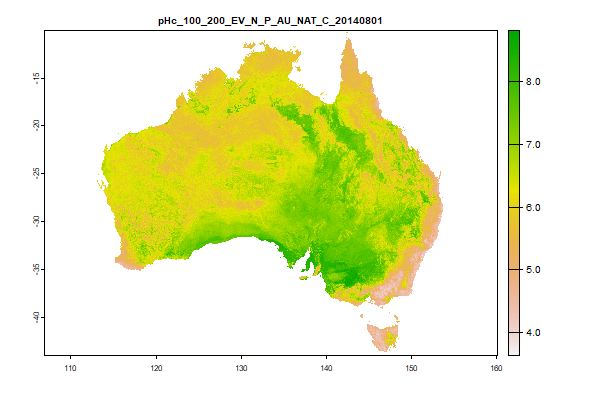
3.4 Gb | pHc_100_200_EV_N_P_AU_NAT_C_20140801.tif | The Modelled-Value for pH CaCl2 (None) at 1 to 2 metres |
 Click to enlarge the image
|
|
3.4 Gb | pHc_000_005_05_N_P_AU_NAT_C_20140801.tif | The Lower-CI for pH CaCl2 (None) at 0 to 0.05 metres |
 Click to enlarge the image
|
|
3.4 Gb | pHc_005_015_05_N_P_AU_NAT_C_20140801.tif | The Lower-CI for pH CaCl2 (None) at 0.05 to 0.15 metres |
 Click to enlarge the image
|
|
3.4 Gb | pHc_015_030_05_N_P_AU_NAT_C_20140801.tif | The Lower-CI for pH CaCl2 (None) at 0.15 to 0.3 metres |
 Click to enlarge the image
|
|
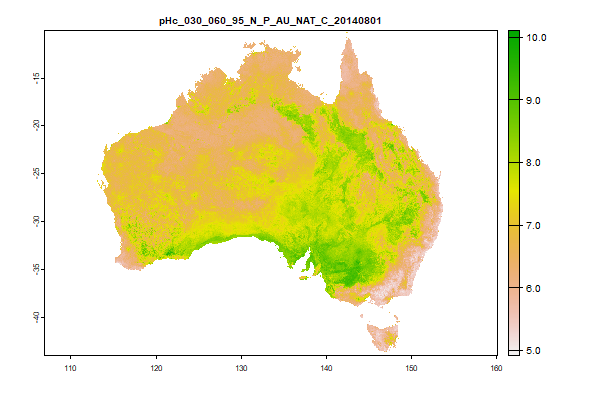
3.5 Gb | pHc_030_060_05_N_P_AU_NAT_C_20140801.tif | The Lower-CI for pH CaCl2 (None) at 0.3 to 0.6 metres |
 Click to enlarge the image
|
|
3.5 Gb | pHc_060_100_05_N_P_AU_NAT_C_20140801.tif | The Lower-CI for pH CaCl2 (None) at 0.6 to 1 metres |
 Click to enlarge the image
|
|
3.5 Gb | pHc_100_200_05_N_P_AU_NAT_C_20140801.tif | The Lower-CI for pH CaCl2 (None) at 1 to 2 metres |
 Click to enlarge the image
|
|
3.4 Gb | pHc_000_005_95_N_P_AU_NAT_C_20140801.tif | The Upper-CI for pH CaCl2 (None) at 0 to 0.05 metres |
 Click to enlarge the image
|
|
3.5 Gb | pHc_005_015_95_N_P_AU_NAT_C_20140801.tif | The Upper-CI for pH CaCl2 (None) at 0.05 to 0.15 metres |
 Click to enlarge the image
|
|
3.5 Gb | pHc_015_030_95_N_P_AU_NAT_C_20140801.tif | The Upper-CI for pH CaCl2 (None) at 0.15 to 0.3 metres |
 Click to enlarge the image
|
|
3.5 Gb | pHc_030_060_95_N_P_AU_NAT_C_20140801.tif | The Upper-CI for pH CaCl2 (None) at 0.3 to 0.6 metres |
 Click to enlarge the image
|
|
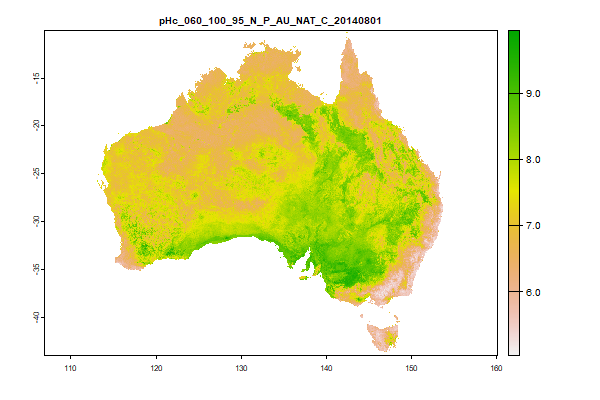
3.5 Gb | pHc_060_100_95_N_P_AU_NAT_C_20140801.tif | The Upper-CI for pH CaCl2 (None) at 0.6 to 1 metres |
 Click to enlarge the image
|
|
3.4 Gb | pHc_100_200_95_N_P_AU_NAT_C_20140801.tif | The Upper-CI for pH CaCl2 (None) at 1 to 2 metres |
| Got to the web directory for this product | ||||
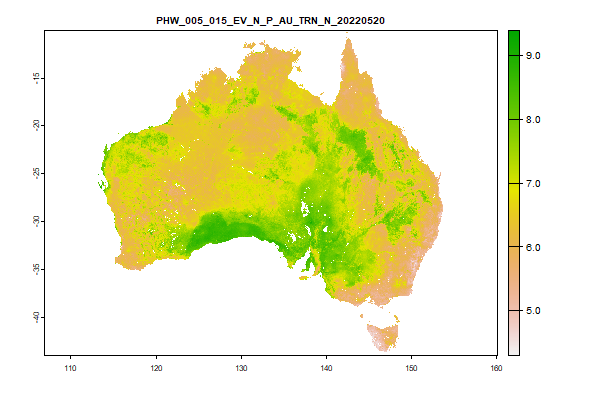
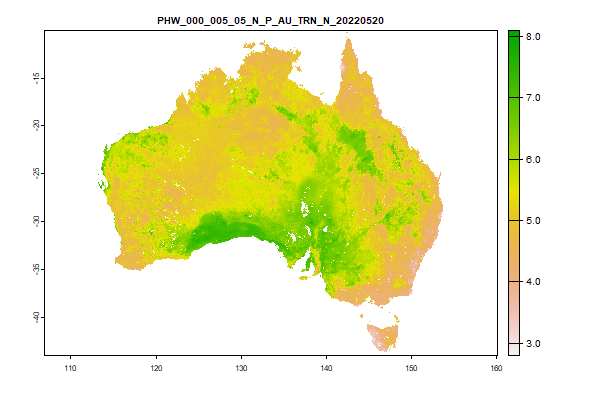
 Click to enlarge the image
|
|
494 Mb | PHW_000_005_EV_N_P_AU_TRN_N_20220520.tif | The Modelled-Value for pH - Water (None) at 0 to 0.05 metres |
 Click to enlarge the image
|
|
523.3 Mb | PHW_005_015_EV_N_P_AU_TRN_N_20220520.tif | The Modelled-Value for pH - Water (None) at 0.05 to 0.15 metres |
 Click to enlarge the image
|
|
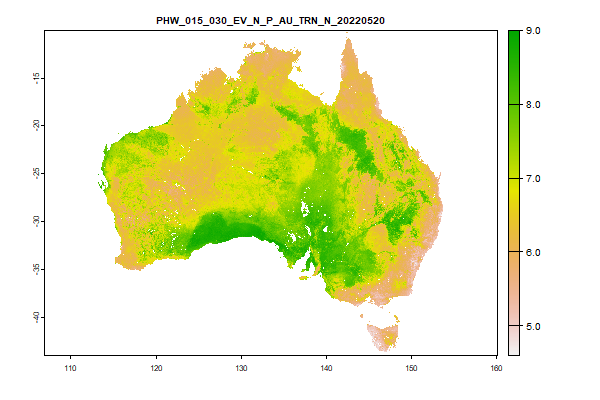
544.7 Mb | PHW_015_030_EV_N_P_AU_TRN_N_20220520.tif | The Modelled-Value for pH - Water (None) at 0.15 to 0.3 metres |
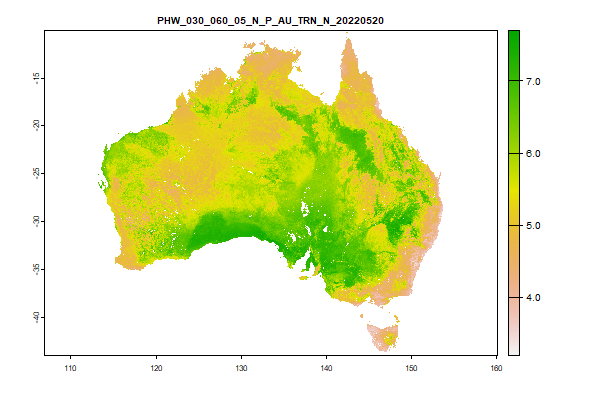
 Click to enlarge the image
|
|
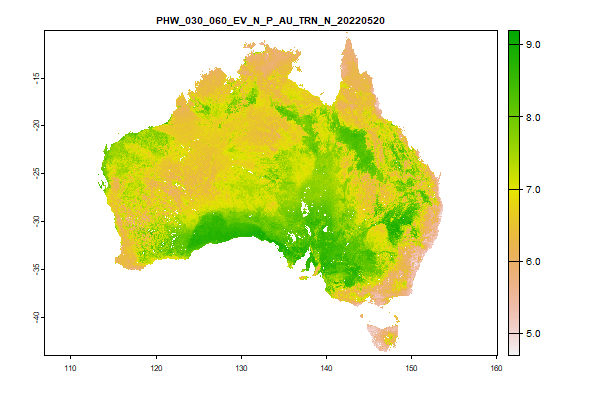
554.7 Mb | PHW_030_060_EV_N_P_AU_TRN_N_20220520.tif | The Modelled-Value for pH - Water (None) at 0.3 to 0.6 metres |
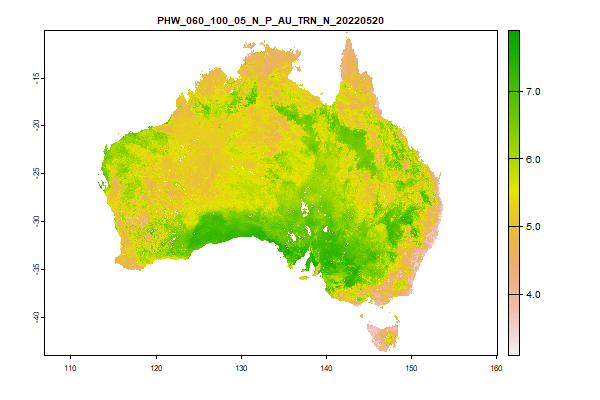
 Click to enlarge the image
|
|
556.4 Mb | PHW_060_100_EV_N_P_AU_TRN_N_20220520.tif | The Modelled-Value for pH - Water (None) at 0.6 to 1 metres |
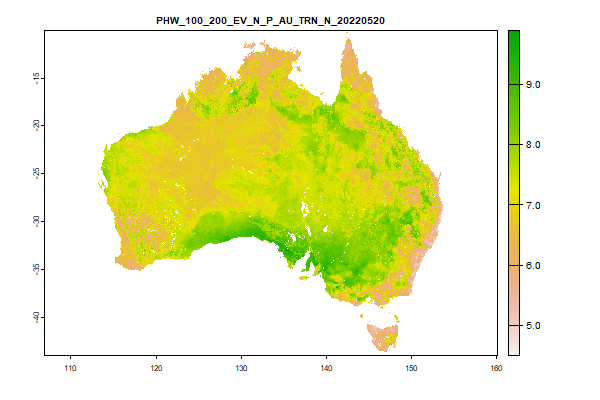 Click to enlarge the image
|
|
570.4 Mb | PHW_100_200_EV_N_P_AU_TRN_N_20220520.tif | The Modelled-Value for pH - Water (None) at 1 to 2 metres |
 Click to enlarge the image
|
|
493.9 Mb | PHW_000_005_05_N_P_AU_TRN_N_20220520.tif | The Lower-CI for pH - Water (None) at 0 to 0.05 metres |
 Click to enlarge the image
|
|
522.5 Mb | PHW_005_015_05_N_P_AU_TRN_N_20220520.tif | The Lower-CI for pH - Water (None) at 0.05 to 0.15 metres |
 Click to enlarge the image
|
|
543.6 Mb | PHW_015_030_05_N_P_AU_TRN_N_20220520.tif | The Lower-CI for pH - Water (None) at 0.15 to 0.3 metres |
 Click to enlarge the image
|
|
553.5 Mb | PHW_030_060_05_N_P_AU_TRN_N_20220520.tif | The Lower-CI for pH - Water (None) at 0.3 to 0.6 metres |
 Click to enlarge the image
|
|
555.7 Mb | PHW_060_100_05_N_P_AU_TRN_N_20220520.tif | The Lower-CI for pH - Water (None) at 0.6 to 1 metres |
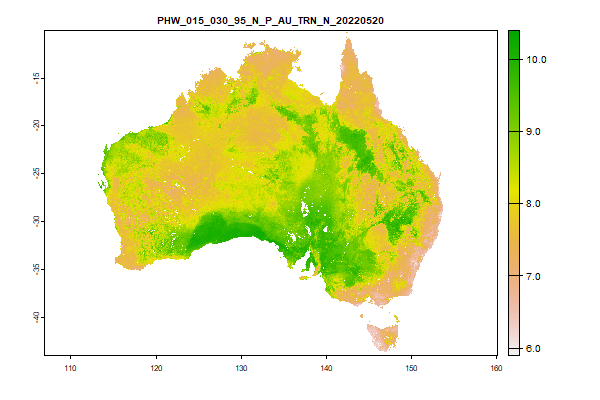
 Click to enlarge the image
|
|
569.7 Mb | PHW_100_200_05_N_P_AU_TRN_N_20220520.tif | The Lower-CI for pH - Water (None) at 1 to 2 metres |
 Click to enlarge the image
|
|
495.8 Mb | PHW_000_005_95_N_P_AU_TRN_N_20220520.tif | The Upper-CI for pH - Water (None) at 0 to 0.05 metres |
 Click to enlarge the image
|
|
524.9 Mb | PHW_005_015_95_N_P_AU_TRN_N_20220520.tif | The Upper-CI for pH - Water (None) at 0.05 to 0.15 metres |
 Click to enlarge the image
|
|
545.4 Mb | PHW_015_030_95_N_P_AU_TRN_N_20220520.tif | The Upper-CI for pH - Water (None) at 0.15 to 0.3 metres |
 Click to enlarge the image
|
|
554.8 Mb | PHW_030_060_95_N_P_AU_TRN_N_20220520.tif | The Upper-CI for pH - Water (None) at 0.3 to 0.6 metres |
 Click to enlarge the image
|
|
556.3 Mb | PHW_060_100_95_N_P_AU_TRN_N_20220520.tif | The Upper-CI for pH - Water (None) at 0.6 to 1 metres |
 Click to enlarge the image
|
|
569.7 Mb | PHW_100_200_95_N_P_AU_TRN_N_20220520.tif | The Upper-CI for pH - Water (None) at 1 to 2 metres |
| Got to the web directory for this product | ||||
 Click to enlarge the image
|
|
3.8 Gb | PTO_000_005_EV_N_P_AU_NAT_C_20140801.tif | The Modelled-Value for Total Phosphorus (%) at 0 to 0.05 metres |
 Click to enlarge the image
|
|
3.8 Gb | PTO_005_015_EV_N_P_AU_NAT_C_20140801.tif | The Modelled-Value for Total Phosphorus (%) at 0.05 to 0.15 metres |
 Click to enlarge the image
|
|
3.7 Gb | PTO_015_030_EV_N_P_AU_NAT_C_20140801.tif | The Modelled-Value for Total Phosphorus (%) at 0.15 to 0.3 metres |
 Click to enlarge the image
|
|
3.7 Gb | PTO_030_060_EV_N_P_AU_NAT_C_20140801.tif | The Modelled-Value for Total Phosphorus (%) at 0.3 to 0.6 metres |
 Click to enlarge the image
|
|
3.7 Gb | PTO_060_100_EV_N_P_AU_NAT_C_20140801.tif | The Modelled-Value for Total Phosphorus (%) at 0.6 to 1 metres |
 Click to enlarge the image
|
|
3.7 Gb | PTO_100_200_EV_N_P_AU_NAT_C_20140801.tif | The Modelled-Value for Total Phosphorus (%) at 1 to 2 metres |
 Click to enlarge the image
|
|
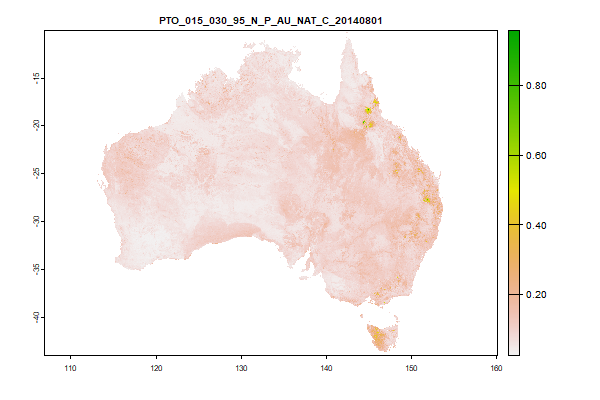
4.1 Gb | PTO_000_005_05_N_P_AU_NAT_C_20140801.tif | The Lower-CI for Total Phosphorus (%) at 0 to 0.05 metres |
 Click to enlarge the image
|
|
3.7 Gb | PTO_005_015_05_N_P_AU_NAT_C_20140801.tif | The Lower-CI for Total Phosphorus (%) at 0.05 to 0.15 metres |
 Click to enlarge the image
|
|
3.7 Gb | PTO_015_030_05_N_P_AU_NAT_C_20140801.tif | The Lower-CI for Total Phosphorus (%) at 0.15 to 0.3 metres |
 Click to enlarge the image
|
|
3.7 Gb | PTO_030_060_05_N_P_AU_NAT_C_20140801.tif | The Lower-CI for Total Phosphorus (%) at 0.3 to 0.6 metres |
 Click to enlarge the image
|
|
3.7 Gb | PTO_060_100_05_N_P_AU_NAT_C_20140801.tif | The Lower-CI for Total Phosphorus (%) at 0.6 to 1 metres |
 Click to enlarge the image
|
|
3.7 Gb | PTO_100_200_05_N_P_AU_NAT_C_20140801.tif | The Lower-CI for Total Phosphorus (%) at 1 to 2 metres |
 Click to enlarge the image
|
|
3.6 Gb | PTO_000_005_95_N_P_AU_NAT_C_20140801.tif | The Upper-CI for Total Phosphorus (%) at 0 to 0.05 metres |
 Click to enlarge the image
|
|
3.8 Gb | PTO_005_015_95_N_P_AU_NAT_C_20140801.tif | The Upper-CI for Total Phosphorus (%) at 0.05 to 0.15 metres |
 Click to enlarge the image
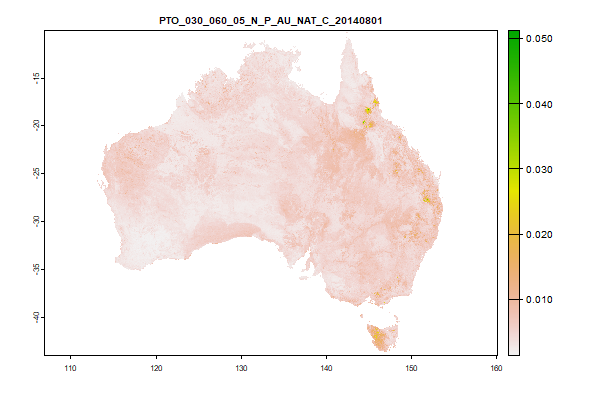
|
|
3.8 Gb | PTO_015_030_95_N_P_AU_NAT_C_20140801.tif | The Upper-CI for Total Phosphorus (%) at 0.15 to 0.3 metres |
 Click to enlarge the image
|
|
3.7 Gb | PTO_030_060_95_N_P_AU_NAT_C_20140801.tif | The Upper-CI for Total Phosphorus (%) at 0.3 to 0.6 metres |
 Click to enlarge the image
|
|
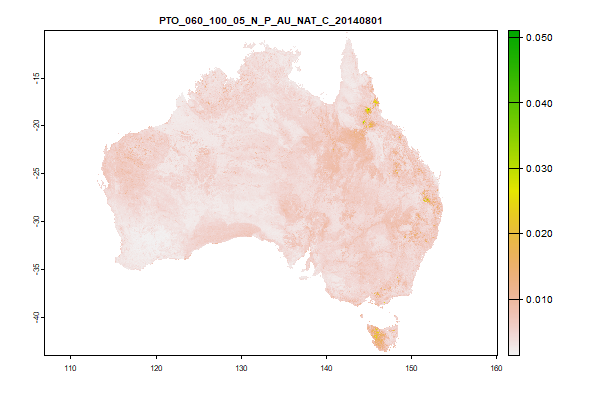
3.7 Gb | PTO_060_100_95_N_P_AU_NAT_C_20140801.tif | The Upper-CI for Total Phosphorus (%) at 0.6 to 1 metres |
 Click to enlarge the image
|
|
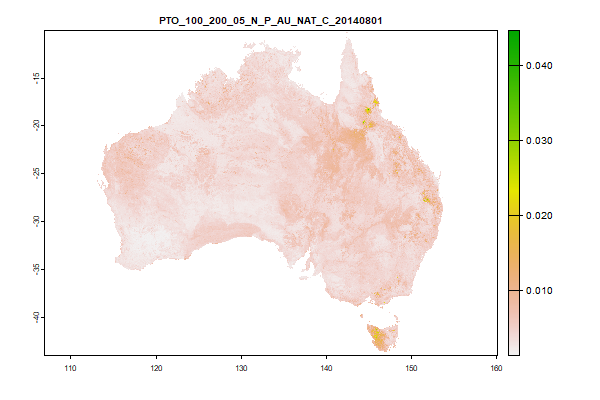
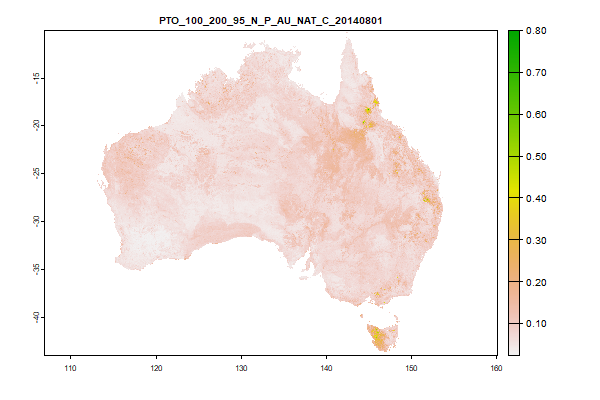
3.7 Gb | PTO_100_200_95_N_P_AU_NAT_C_20140801.tif | The Upper-CI for Total Phosphorus (%) at 1 to 2 metres |
| Got to the web directory for this product | ||||
 Click to enlarge the image
|
|
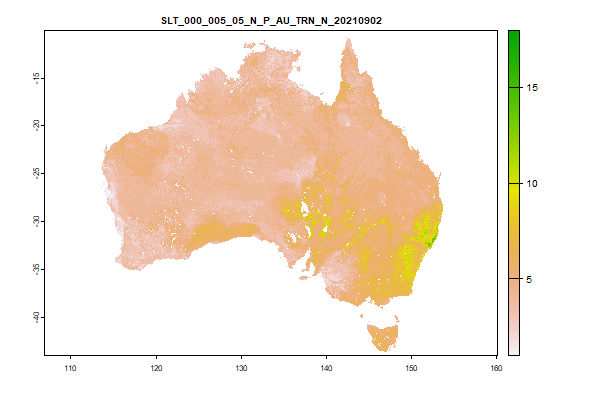
401.3 Mb | SLT_000_005_EV_N_P_AU_TRN_N_20210902.tif | The Modelled-Value for Silt (%) at 0 to 0.05 metres |
 Click to enlarge the image
|
|
395.5 Mb | SLT_005_015_EV_N_P_AU_TRN_N_20210902.tif | The Modelled-Value for Silt (%) at 0.05 to 0.15 metres |
 Click to enlarge the image
|
|
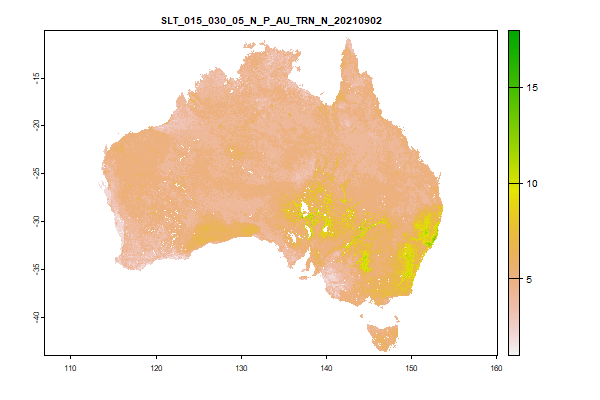
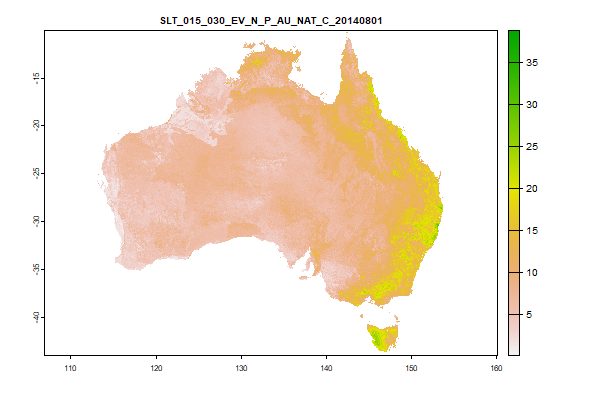
405.9 Mb | SLT_015_030_EV_N_P_AU_TRN_N_20210902.tif | The Modelled-Value for Silt (%) at 0.15 to 0.3 metres |
 Click to enlarge the image
|
|
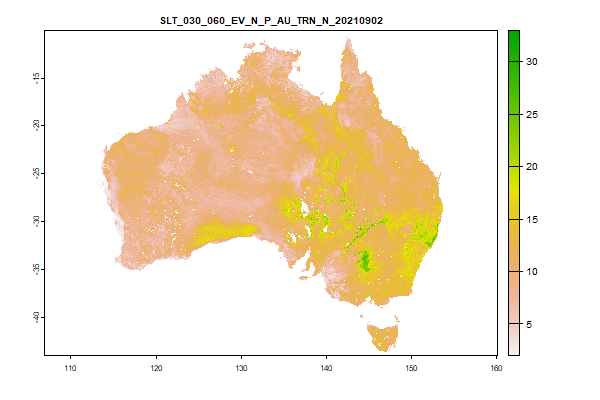
404.2 Mb | SLT_030_060_EV_N_P_AU_TRN_N_20210902.tif | The Modelled-Value for Silt (%) at 0.3 to 0.6 metres |
 Click to enlarge the image
|
|
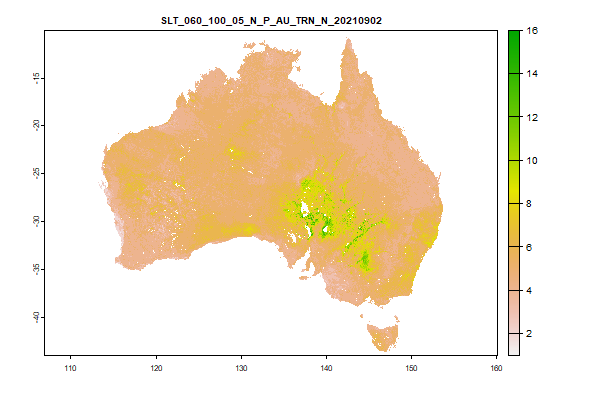
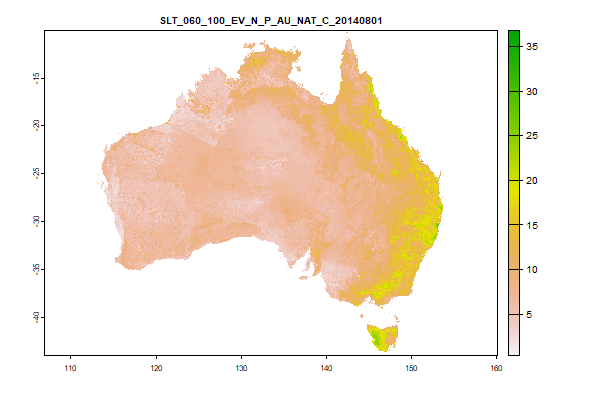
402.7 Mb | SLT_060_100_EV_N_P_AU_TRN_N_20210902.tif | The Modelled-Value for Silt (%) at 0.6 to 1 metres |
 Click to enlarge the image
|
|
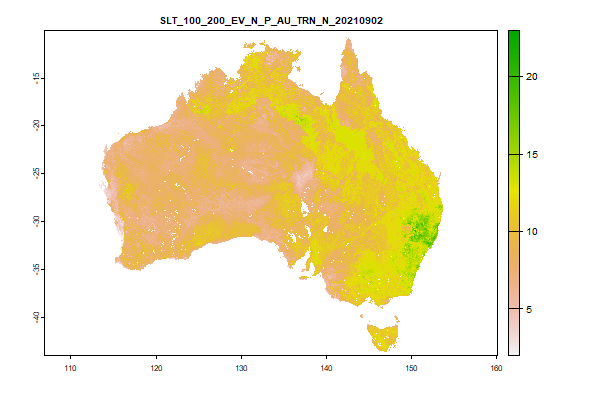
296.9 Mb | SLT_100_200_EV_N_P_AU_TRN_N_20210902.tif | The Modelled-Value for Silt (%) at 1 to 2 metres |
 Click to enlarge the image
|
|
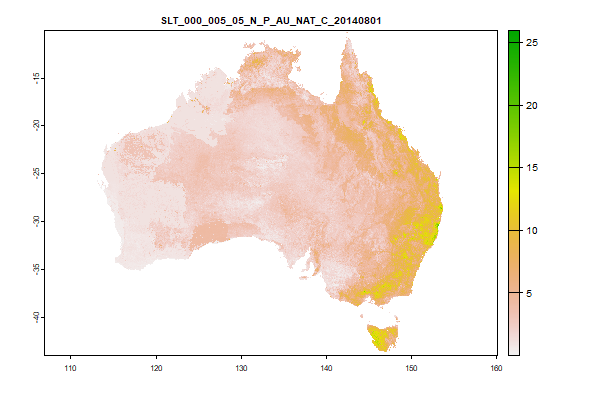
208 Mb | SLT_000_005_05_N_P_AU_TRN_N_20210902.tif | The Lower-CI for Silt (%) at 0 to 0.05 metres |
 Click to enlarge the image
|
|
214.7 Mb | SLT_005_015_05_N_P_AU_TRN_N_20210902.tif | The Lower-CI for Silt (%) at 0.05 to 0.15 metres |
 Click to enlarge the image
|
|
201.6 Mb | SLT_015_030_05_N_P_AU_TRN_N_20210902.tif | The Lower-CI for Silt (%) at 0.15 to 0.3 metres |
 Click to enlarge the image
|
|
202.7 Mb | SLT_030_060_05_N_P_AU_TRN_N_20210902.tif | The Lower-CI for Silt (%) at 0.3 to 0.6 metres |
 Click to enlarge the image
|
|
212.7 Mb | SLT_060_100_05_N_P_AU_TRN_N_20210902.tif | The Lower-CI for Silt (%) at 0.6 to 1 metres |
 Click to enlarge the image
|
|
132.5 Mb | SLT_100_200_05_N_P_AU_TRN_N_20210902.tif | The Lower-CI for Silt (%) at 1 to 2 metres |
 Click to enlarge the image
|
|
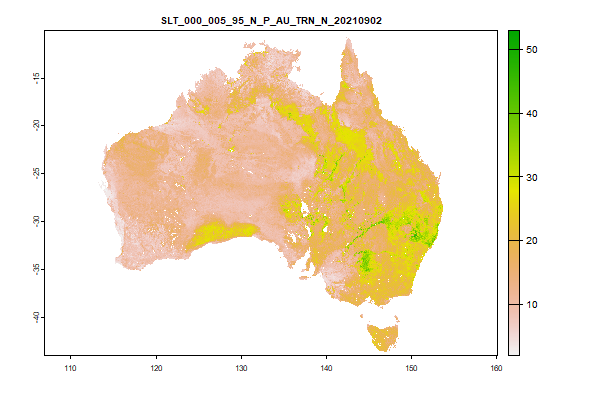
553.6 Mb | SLT_000_005_95_N_P_AU_TRN_N_20210902.tif | The Upper-CI for Silt (%) at 0 to 0.05 metres |
 Click to enlarge the image
|
|
532.1 Mb | SLT_005_015_95_N_P_AU_TRN_N_20210902.tif | The Upper-CI for Silt (%) at 0.05 to 0.15 metres |
 Click to enlarge the image
|
|
552.9 Mb | SLT_015_030_95_N_P_AU_TRN_N_20210902.tif | The Upper-CI for Silt (%) at 0.15 to 0.3 metres |
 Click to enlarge the image
|
|
561 Mb | SLT_030_060_95_N_P_AU_TRN_N_20210902.tif | The Upper-CI for Silt (%) at 0.3 to 0.6 metres |
 Click to enlarge the image
|
|
546.1 Mb | SLT_060_100_95_N_P_AU_TRN_N_20210902.tif | The Upper-CI for Silt (%) at 0.6 to 1 metres |
 Click to enlarge the image
|
|
479.8 Mb | SLT_100_200_95_N_P_AU_TRN_N_20210902.tif | The Upper-CI for Silt (%) at 1 to 2 metres |
| Got to the web directory for this product | ||||
 Click to enlarge the image
|
|
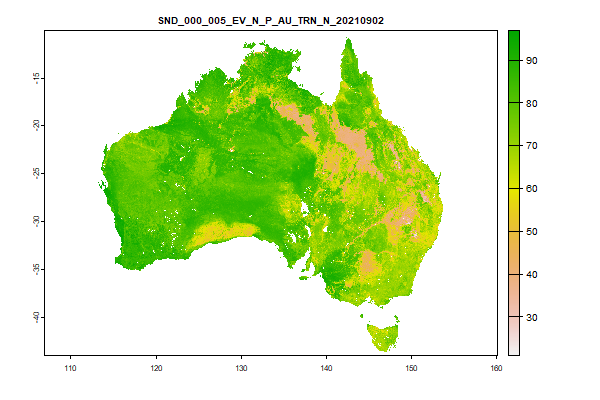
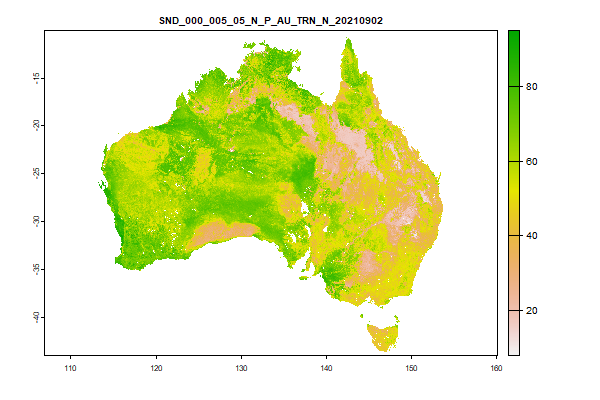
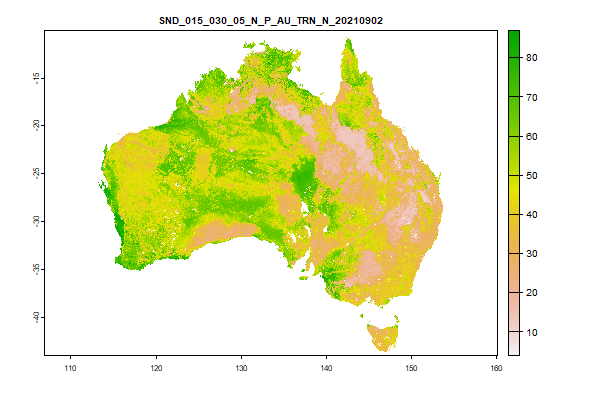
706.9 Mb | SND_000_005_EV_N_P_AU_TRN_N_20210902.tif | The Modelled-Value for Sand (%) at 0 to 0.05 metres |
 Click to enlarge the image
|
|
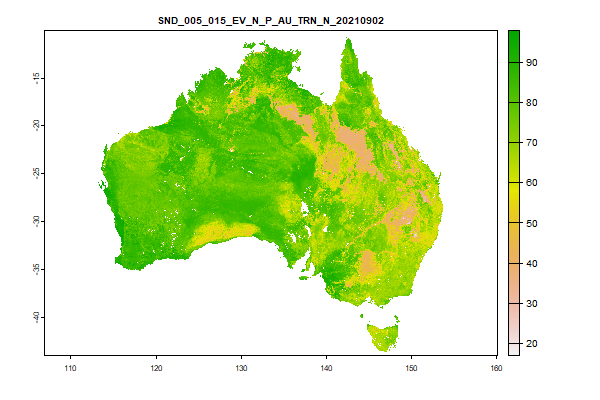
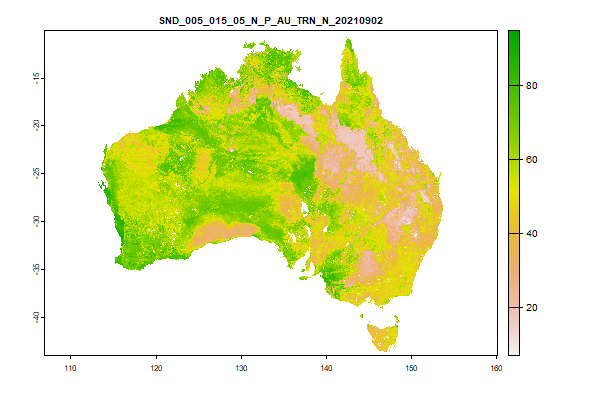
726.4 Mb | SND_005_015_EV_N_P_AU_TRN_N_20210902.tif | The Modelled-Value for Sand (%) at 0.05 to 0.15 metres |
 Click to enlarge the image
|
|
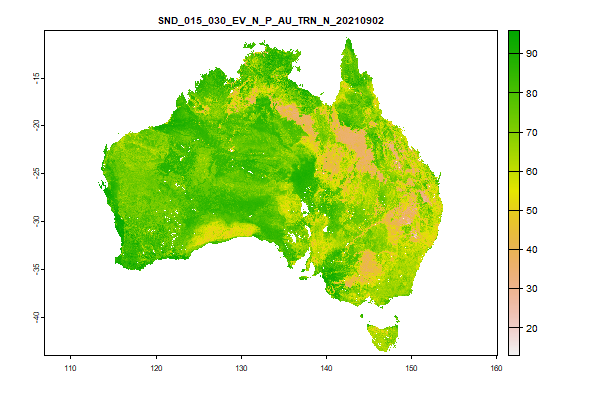
775.8 Mb | SND_015_030_EV_N_P_AU_TRN_N_20210902.tif | The Modelled-Value for Sand (%) at 0.15 to 0.3 metres |
 Click to enlarge the image
|
|
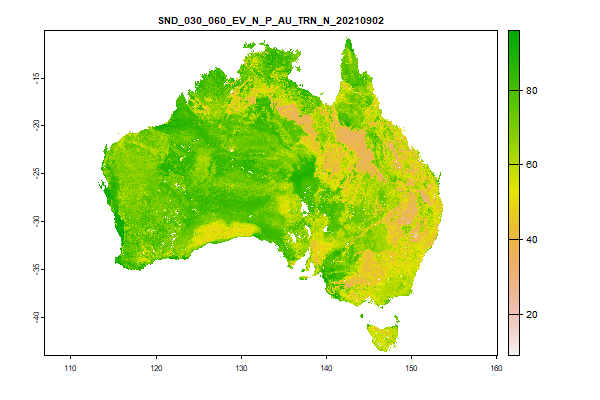
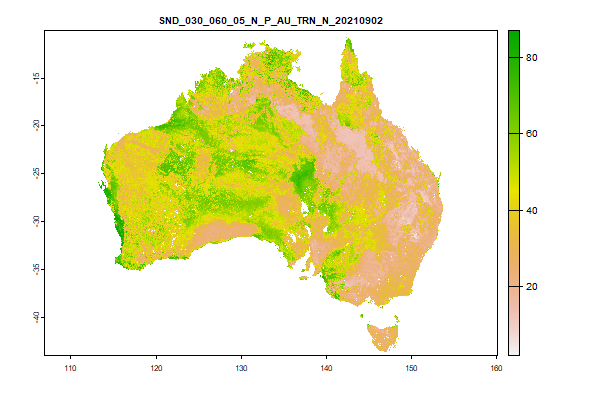
807 Mb | SND_030_060_EV_N_P_AU_TRN_N_20210902.tif | The Modelled-Value for Sand (%) at 0.3 to 0.6 metres |
 Click to enlarge the image
|
|
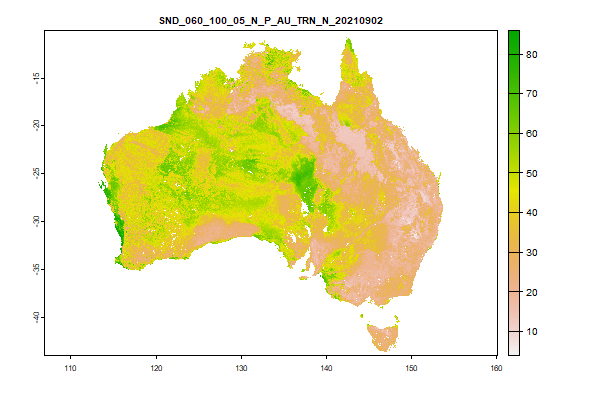
751 Mb | SND_060_100_EV_N_P_AU_TRN_N_20210902.tif | The Modelled-Value for Sand (%) at 0.6 to 1 metres |
 Click to enlarge the image
|
|
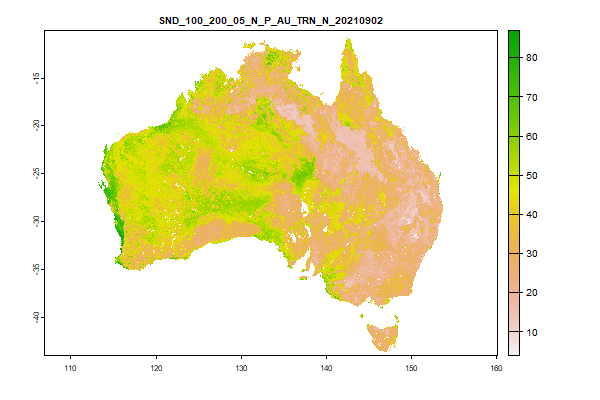
798.2 Mb | SND_100_200_EV_N_P_AU_TRN_N_20210902.tif | The Modelled-Value for Sand (%) at 1 to 2 metres |
 Click to enlarge the image
|
|
827.5 Mb | SND_000_005_05_N_P_AU_TRN_N_20210902.tif | The Lower-CI for Sand (%) at 0 to 0.05 metres |
 Click to enlarge the image
|
|
840.1 Mb | SND_005_015_05_N_P_AU_TRN_N_20210902.tif | The Lower-CI for Sand (%) at 0.05 to 0.15 metres |
 Click to enlarge the image
|
|
868.8 Mb | SND_015_030_05_N_P_AU_TRN_N_20210902.tif | The Lower-CI for Sand (%) at 0.15 to 0.3 metres |
 Click to enlarge the image
|
|
866.2 Mb | SND_030_060_05_N_P_AU_TRN_N_20210902.tif | The Lower-CI for Sand (%) at 0.3 to 0.6 metres |
 Click to enlarge the image
|
|
781.9 Mb | SND_060_100_05_N_P_AU_TRN_N_20210902.tif | The Lower-CI for Sand (%) at 0.6 to 1 metres |
 Click to enlarge the image
|
|
834 Mb | SND_100_200_05_N_P_AU_TRN_N_20210902.tif | The Lower-CI for Sand (%) at 1 to 2 metres |
 Click to enlarge the image
|
|
624.7 Mb | SND_000_005_95_N_P_AU_TRN_N_20210902.tif | The Upper-CI for Sand (%) at 0 to 0.05 metres |
 Click to enlarge the image
|
|
623.5 Mb | SND_005_015_95_N_P_AU_TRN_N_20210902.tif | The Upper-CI for Sand (%) at 0.05 to 0.15 metres |
 Click to enlarge the image
|
|
646.8 Mb | SND_015_030_95_N_P_AU_TRN_N_20210902.tif | The Upper-CI for Sand (%) at 0.15 to 0.3 metres |
 Click to enlarge the image
|
|
668.9 Mb | SND_030_060_95_N_P_AU_TRN_N_20210902.tif | The Upper-CI for Sand (%) at 0.3 to 0.6 metres |
 Click to enlarge the image
|
|
640.1 Mb | SND_060_100_95_N_P_AU_TRN_N_20210902.tif | The Upper-CI for Sand (%) at 0.6 to 1 metres |
 Click to enlarge the image
|
|
647 Mb | SND_100_200_95_N_P_AU_TRN_N_20210902.tif | The Upper-CI for Sand (%) at 1 to 2 metres |
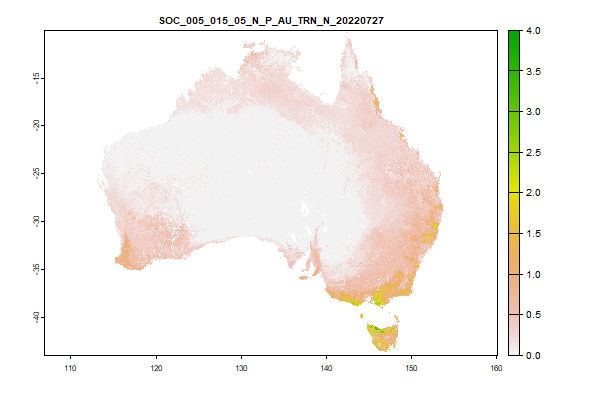
| Got to the web directory for this product | ||||
 Click to enlarge the image
|
|
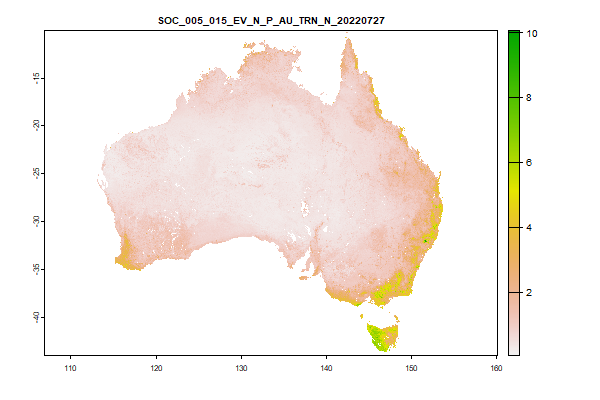
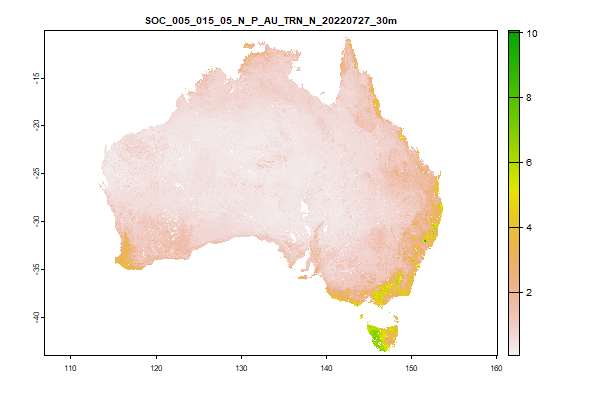
1.3 Gb | SOC_000_005_EV_N_P_AU_TRN_N_20220727.tif | The Modelled-Value for Organic Carbon (%) at 0 to 0.05 metres |
 Click to enlarge the image
|
|
1.2 Gb | SOC_005_015_EV_N_P_AU_TRN_N_20220727.tif | The Modelled-Value for Organic Carbon (%) at 0.05 to 0.15 metres |
 Click to enlarge the image
|
|
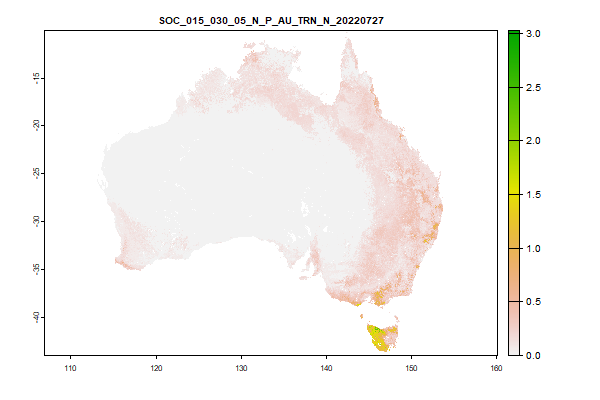
1 Gb | SOC_015_030_EV_N_P_AU_TRN_N_20220727.tif | The Modelled-Value for Organic Carbon (%) at 0.15 to 0.3 metres |
 Click to enlarge the image
|
|
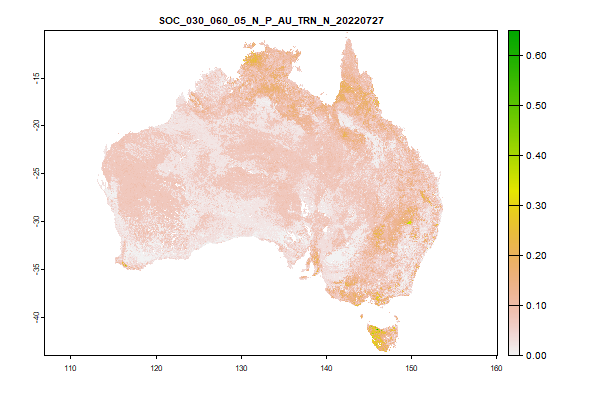
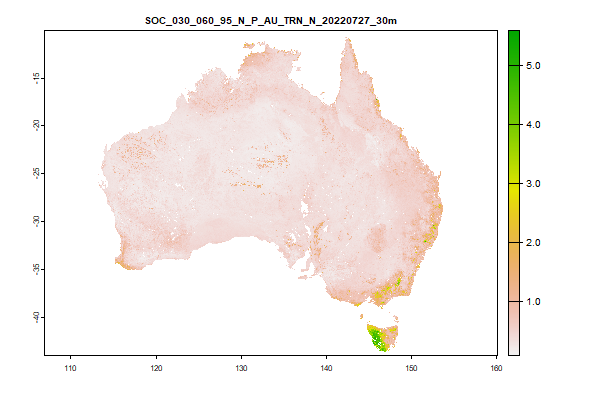
1015.1 Mb | SOC_030_060_EV_N_P_AU_TRN_N_20220727.tif | The Modelled-Value for Organic Carbon (%) at 0.3 to 0.6 metres |
 Click to enlarge the image
|
|
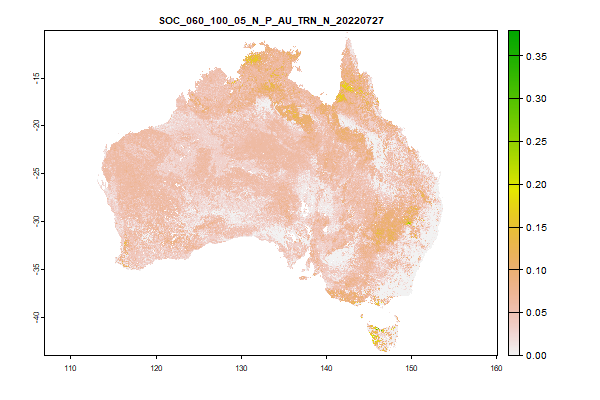
898.1 Mb | SOC_060_100_EV_N_P_AU_TRN_N_20220727.tif | The Modelled-Value for Organic Carbon (%) at 0.6 to 1 metres |
 Click to enlarge the image
|
|
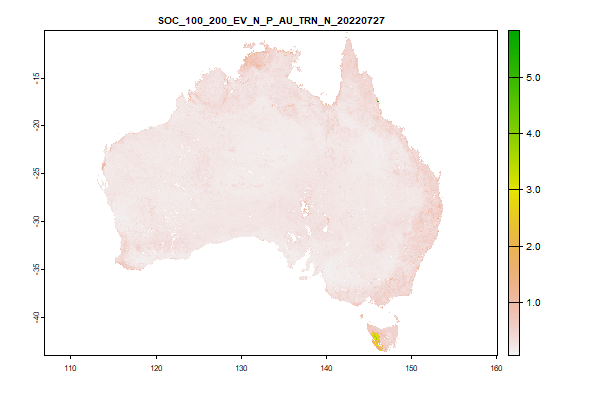
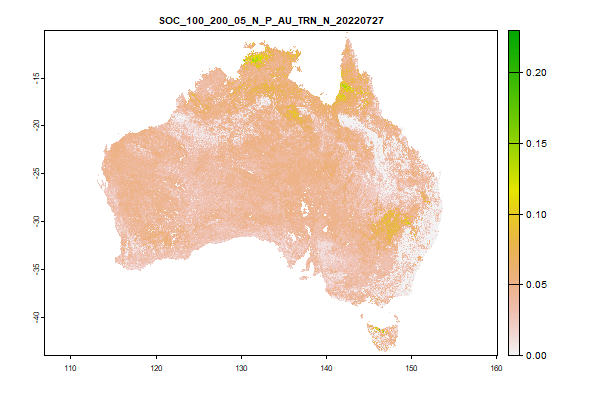
860.3 Mb | SOC_100_200_EV_N_P_AU_TRN_N_20220727.tif | The Modelled-Value for Organic Carbon (%) at 1 to 2 metres |
 Click to enlarge the image
|
|
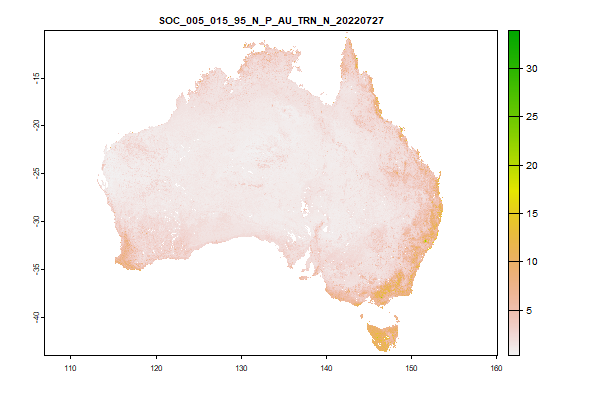
689.8 Mb | SOC_000_005_05_N_P_AU_TRN_N_20220727.tif | The Lower-CI for Organic Carbon (%) at 0 to 0.05 metres |
 Click to enlarge the image
|
|
652.2 Mb | SOC_005_015_05_N_P_AU_TRN_N_20220727.tif | The Lower-CI for Organic Carbon (%) at 0.05 to 0.15 metres |
 Click to enlarge the image
|
|
428.2 Mb | SOC_015_030_05_N_P_AU_TRN_N_20220727.tif | The Lower-CI for Organic Carbon (%) at 0.15 to 0.3 metres |
 Click to enlarge the image
|
|
616.6 Mb | SOC_030_060_05_N_P_AU_TRN_N_20220727.tif | The Lower-CI for Organic Carbon (%) at 0.3 to 0.6 metres |
 Click to enlarge the image
|
|
533.8 Mb | SOC_060_100_05_N_P_AU_TRN_N_20220727.tif | The Lower-CI for Organic Carbon (%) at 0.6 to 1 metres |
 Click to enlarge the image
|
|
450.3 Mb | SOC_100_200_05_N_P_AU_TRN_N_20220727.tif | The Lower-CI for Organic Carbon (%) at 1 to 2 metres |
 Click to enlarge the image
|
|
1.6 Gb | SOC_000_005_95_N_P_AU_TRN_N_20220727.tif | The Upper-CI for Organic Carbon (%) at 0 to 0.05 metres |
 Click to enlarge the image
|
|
1.5 Gb | SOC_005_015_95_N_P_AU_TRN_N_20220727.tif | The Upper-CI for Organic Carbon (%) at 0.05 to 0.15 metres |
 Click to enlarge the image
|
|
1.3 Gb | SOC_015_030_95_N_P_AU_TRN_N_20220727.tif | The Upper-CI for Organic Carbon (%) at 0.15 to 0.3 metres |
 Click to enlarge the image
|
|
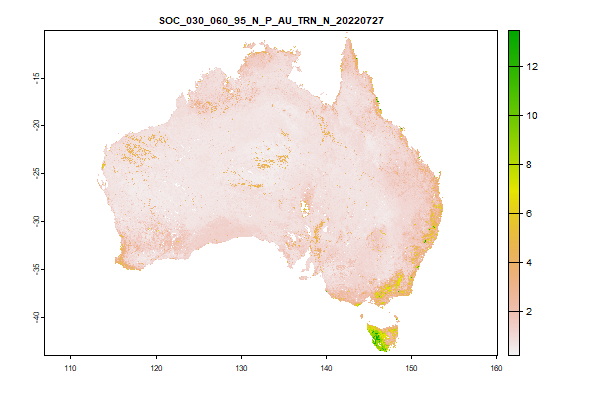
1.2 Gb | SOC_030_060_95_N_P_AU_TRN_N_20220727.tif | The Upper-CI for Organic Carbon (%) at 0.3 to 0.6 metres |
 Click to enlarge the image
|
|
1.1 Gb | SOC_060_100_95_N_P_AU_TRN_N_20220727.tif | The Upper-CI for Organic Carbon (%) at 0.6 to 1 metres |
 Click to enlarge the image
|
|
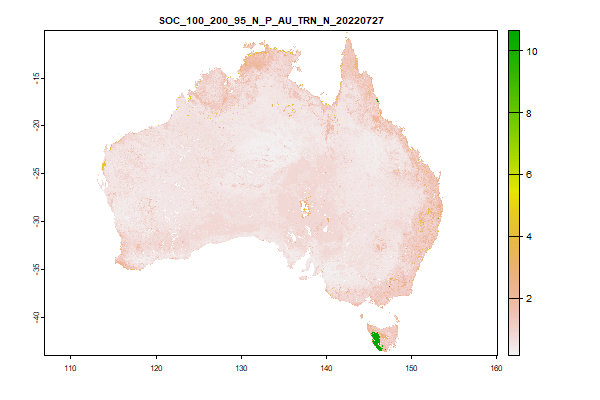
1 Gb | SOC_100_200_95_N_P_AU_TRN_N_20220727.tif | The Upper-CI for Organic Carbon (%) at 1 to 2 metres |
| Got to the web directory for this product | ||||
 Click to enlarge the image
|
|
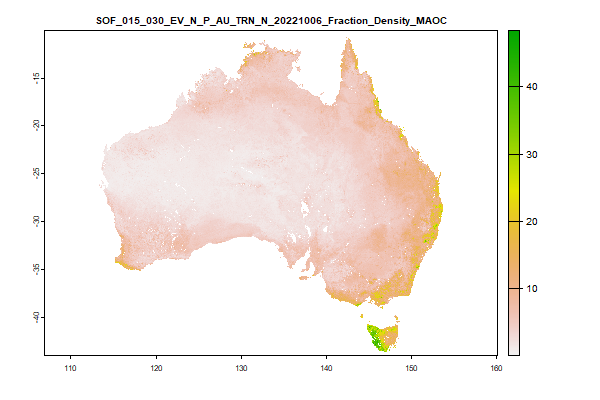
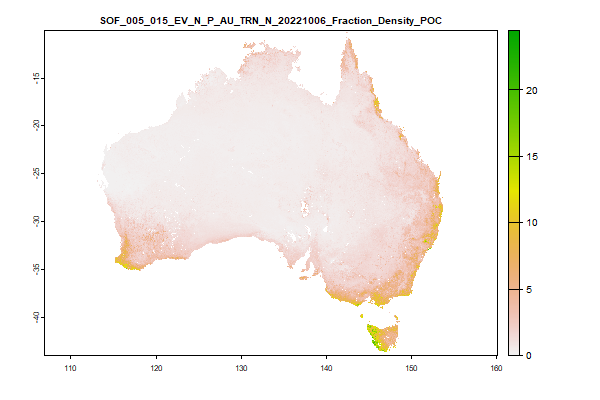
1.2 Gb | SOF_005_015_EV_N_P_AU_TRN_N_20221006_Fraction_Density_MAOC.tif | The Upper-CI for Soil Organic Carbon Fractions (%) at NA to NA metres |
 Click to enlarge the image
|
|
1 Gb | SOF_015_030_EV_N_P_AU_TRN_N_20221006_Fraction_Density_MAOC.tif | The Upper-CI for Soil Organic Carbon Fractions (%) at NA to NA metres |
 Click to enlarge the image
|
|
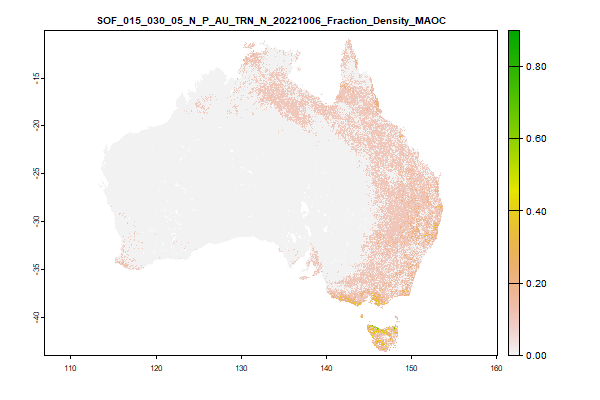
119.4 Mb | SOF_015_030_05_N_P_AU_TRN_N_20221006_Fraction_Density_MAOC.tif | The Upper-CI for Soil Organic Carbon Fractions (%) at NA to NA metres |
 Click to enlarge the image
|
|
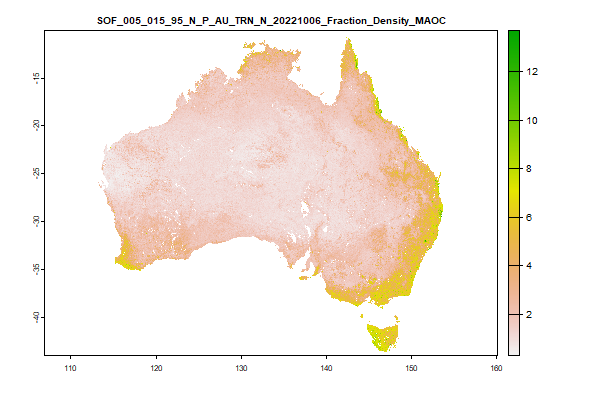
968.2 Mb | SOF_005_015_95_N_P_AU_TRN_N_20221006_Fraction_Density_MAOC.tif | The Upper-CI for Soil Organic Carbon Fractions (%) at NA to NA metres |
 Click to enlarge the image
|
|
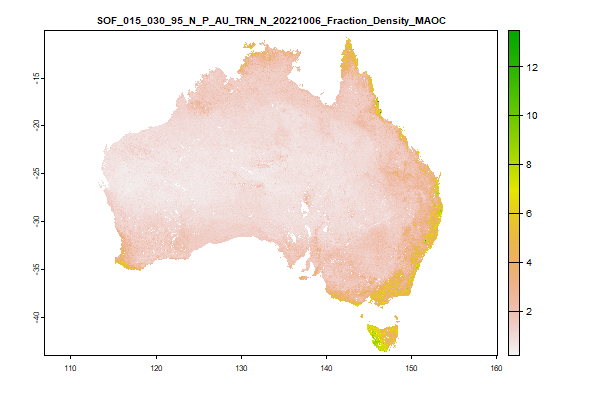
829 Mb | SOF_015_030_95_N_P_AU_TRN_N_20221006_Fraction_Density_MAOC.tif | The Upper-CI for Soil Organic Carbon Fractions (%) at NA to NA metres |
 Click to enlarge the image
|
|
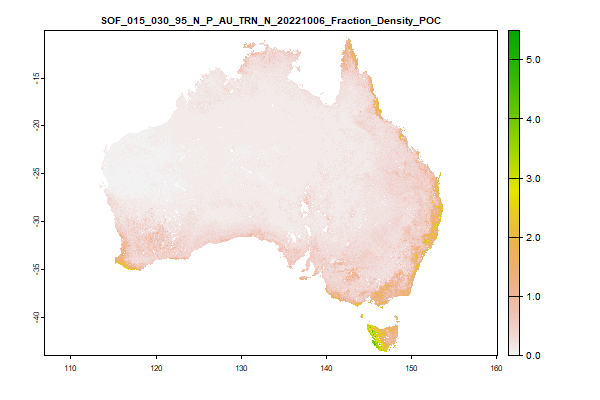
591.8 Mb | SOF_005_015_EV_N_P_AU_TRN_N_20221006_Fraction_Density_POC.tif | The Upper-CI for Soil Organic Carbon Fractions (%) at NA to NA metres |
 Click to enlarge the image
|
|
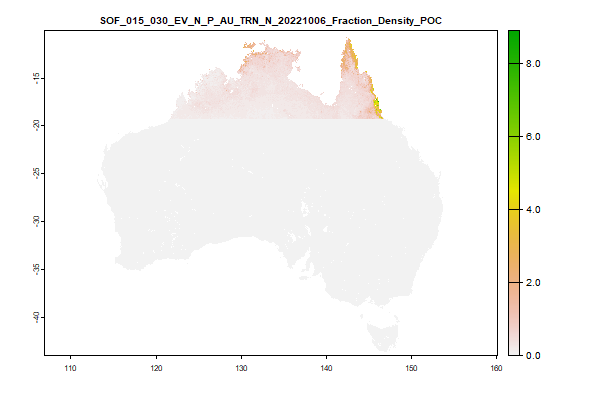
74.1 Mb | SOF_015_030_EV_N_P_AU_TRN_N_20221006_Fraction_Density_POC.tif | The Upper-CI for Soil Organic Carbon Fractions (%) at NA to NA metres |
 Click to enlarge the image
|
|
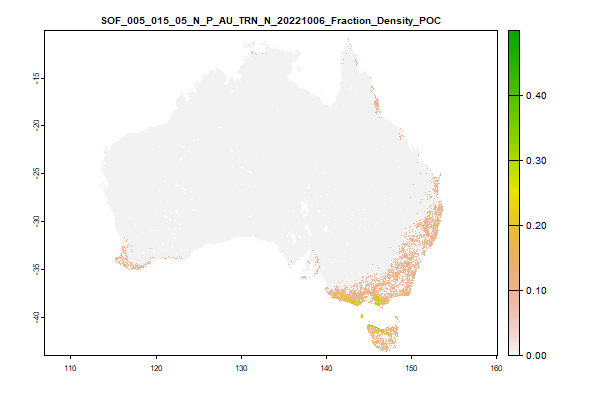
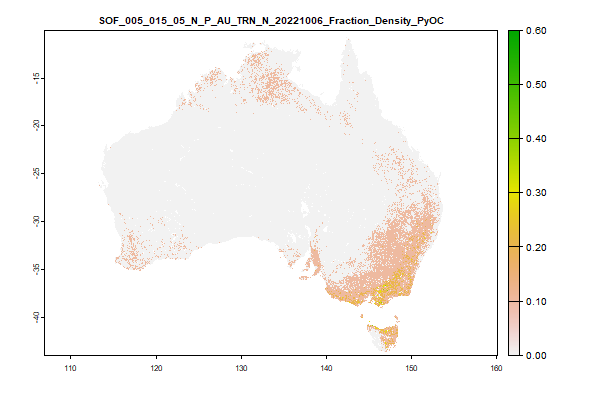
44.4 Mb | SOF_005_015_05_N_P_AU_TRN_N_20221006_Fraction_Density_POC.tif | The Upper-CI for Soil Organic Carbon Fractions (%) at NA to NA metres |
 Click to enlarge the image
|
|
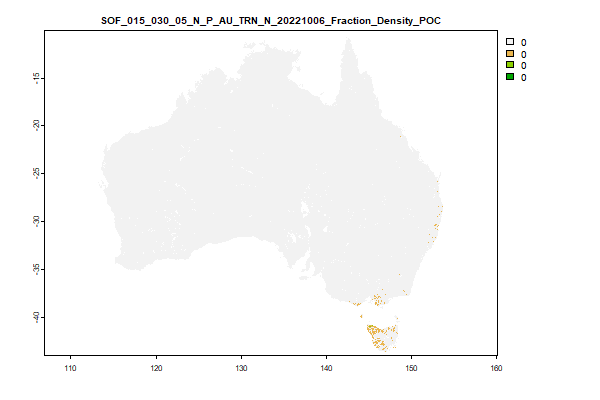
20.5 Mb | SOF_015_030_05_N_P_AU_TRN_N_20221006_Fraction_Density_POC.tif | The Upper-CI for Soil Organic Carbon Fractions (%) at NA to NA metres |
 Click to enlarge the image
|
|
474 Mb | SOF_005_015_95_N_P_AU_TRN_N_20221006_Fraction_Density_POC.tif | The Upper-CI for Soil Organic Carbon Fractions (%) at NA to NA metres |
 Click to enlarge the image
|
|
349.2 Mb | SOF_015_030_95_N_P_AU_TRN_N_20221006_Fraction_Density_POC.tif | The Upper-CI for Soil Organic Carbon Fractions (%) at NA to NA metres |
 Click to enlarge the image
|
|
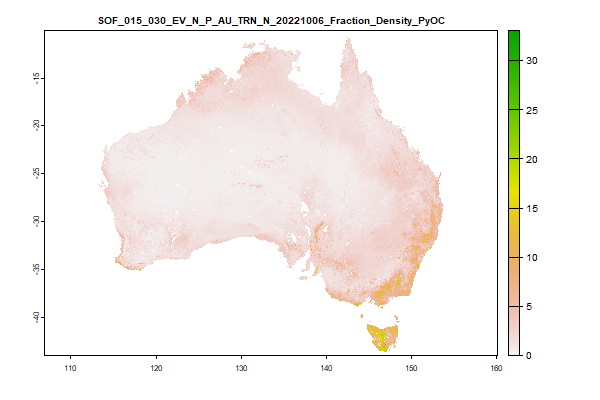
960.3 Mb | SOF_005_015_EV_N_P_AU_TRN_N_20221006_Fraction_Density_PyOC.tif | The Upper-CI for Soil Organic Carbon Fractions (%) at NA to NA metres |
 Click to enlarge the image
|
|
740.1 Mb | SOF_015_030_EV_N_P_AU_TRN_N_20221006_Fraction_Density_PyOC.tif | The Upper-CI for Soil Organic Carbon Fractions (%) at NA to NA metres |
 Click to enlarge the image
|
|
85.5 Mb | SOF_005_015_05_N_P_AU_TRN_N_20221006_Fraction_Density_PyOC.tif | The Upper-CI for Soil Organic Carbon Fractions (%) at NA to NA metres |
 Click to enlarge the image
|
|
29.4 Mb | SOF_015_030_05_N_P_AU_TRN_N_20221006_Fraction_Density_PyOC.tif | The Upper-CI for Soil Organic Carbon Fractions (%) at NA to NA metres |
 Click to enlarge the image
|
|
778.4 Mb | SOF_005_015_95_N_P_AU_TRN_N_20221006_Fraction_Density_PyOC.tif | The Upper-CI for Soil Organic Carbon Fractions (%) at NA to NA metres |
 Click to enlarge the image
|
|
649.7 Mb | SOF_015_030_95_N_P_AU_TRN_N_20221006_Fraction_Density_PyOC.tif | The Upper-CI for Soil Organic Carbon Fractions (%) at NA to NA metres |
| Got to the web directory for this product | ||||
 Click to enlarge the image
|
|
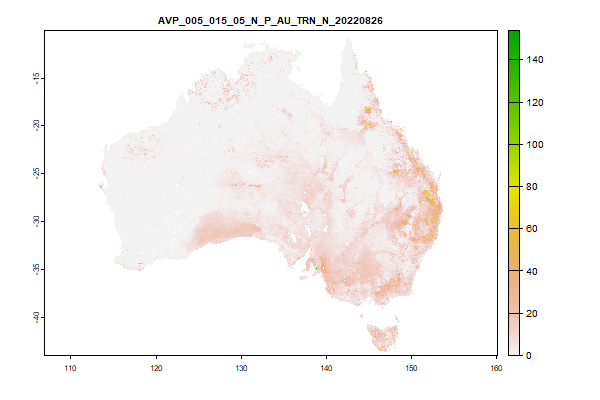
521.3 Mb | AVP_000_005_EV_N_P_AU_TRN_N_20220826.tif | The Modelled-Value for Available phosphorus (mg/kg) at 0 to 0.05 metres |
 Click to enlarge the image
|
|
473.8 Mb | AVP_005_015_EV_N_P_AU_TRN_N_20220826.tif | The Modelled-Value for Available phosphorus (mg/kg) at 0.05 to 0.15 metres |
 Click to enlarge the image
|
|
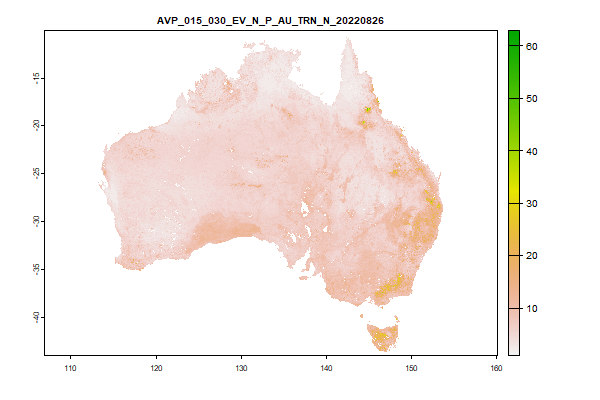
294.6 Mb | AVP_015_030_EV_N_P_AU_TRN_N_20220826.tif | The Modelled-Value for Available phosphorus (mg/kg) at 0.15 to 0.3 metres |
 Click to enlarge the image
|
|
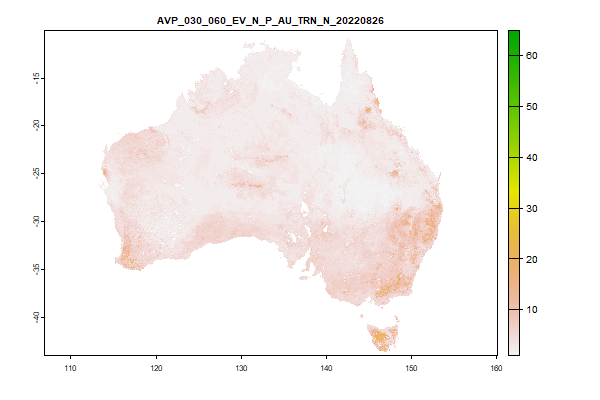
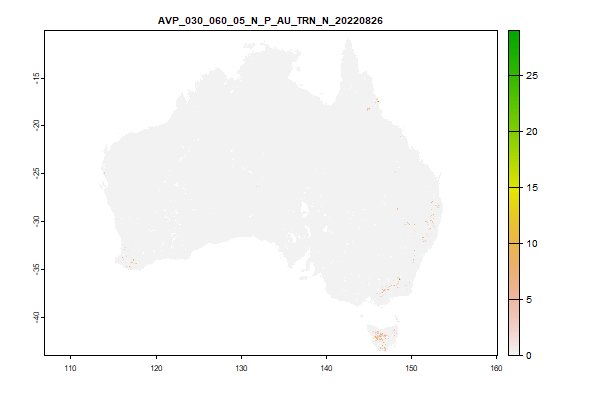
211.6 Mb | AVP_030_060_EV_N_P_AU_TRN_N_20220826.tif | The Modelled-Value for Available phosphorus (mg/kg) at 0.3 to 0.6 metres |
 Click to enlarge the image
|
|
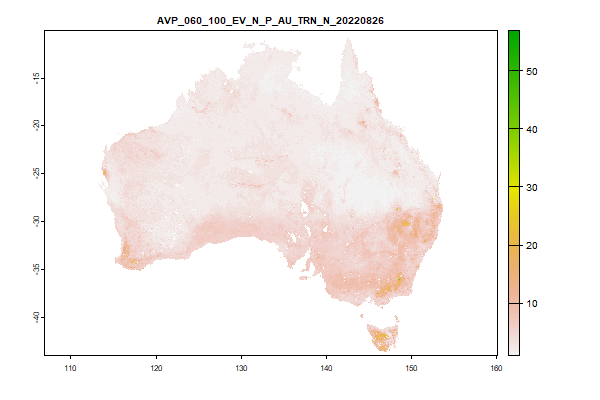
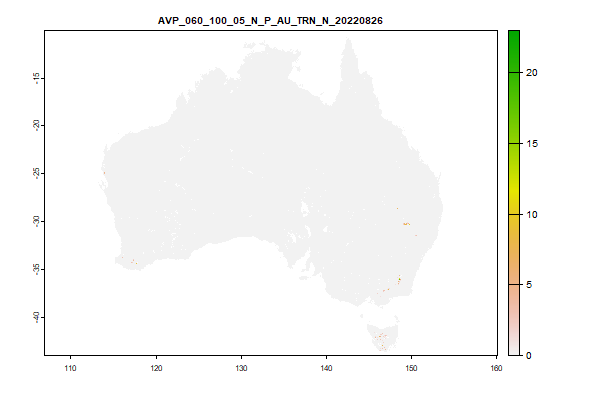
184.9 Mb | AVP_060_100_EV_N_P_AU_TRN_N_20220826.tif | The Modelled-Value for Available phosphorus (mg/kg) at 0.6 to 1 metres |
 Click to enlarge the image
|
|
163.9 Mb | AVP_100_200_EV_N_P_AU_TRN_N_20220826.tif | The Modelled-Value for Available phosphorus (mg/kg) at 1 to 2 metres |
 Click to enlarge the image
|
|
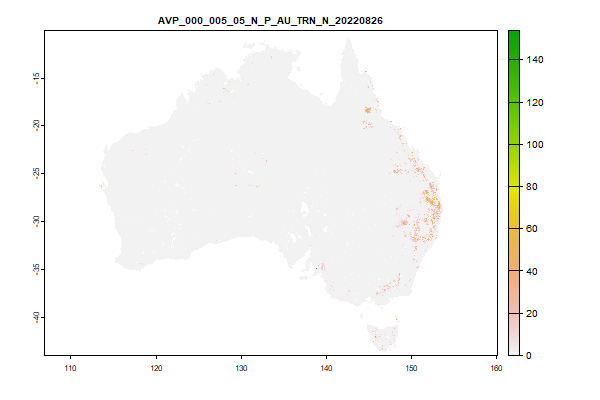
47.9 Mb | AVP_000_005_05_N_P_AU_TRN_N_20220826.tif | The Lower-CI for Available phosphorus (mg/kg) at 0 to 0.05 metres |
 Click to enlarge the image
|
|
350.8 Mb | AVP_005_015_05_N_P_AU_TRN_N_20220826.tif | The Lower-CI for Available phosphorus (mg/kg) at 0.05 to 0.15 metres |
 Click to enlarge the image
|
|
14.1 Mb | AVP_015_030_05_N_P_AU_TRN_N_20220826.tif | The Lower-CI for Available phosphorus (mg/kg) at 0.15 to 0.3 metres |
 Click to enlarge the image
|
|
15.5 Mb | AVP_030_060_05_N_P_AU_TRN_N_20220826.tif | The Lower-CI for Available phosphorus (mg/kg) at 0.3 to 0.6 metres |
 Click to enlarge the image
|
|
11.9 Mb | AVP_060_100_05_N_P_AU_TRN_N_20220826.tif | The Lower-CI for Available phosphorus (mg/kg) at 0.6 to 1 metres |
 Click to enlarge the image
|
|
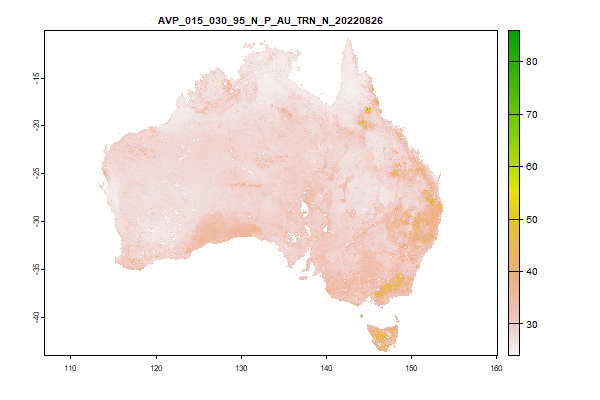
10.3 Mb | AVP_100_200_05_N_P_AU_TRN_N_20220826.tif | The Lower-CI for Available phosphorus (mg/kg) at 1 to 2 metres |
 Click to enlarge the image
|
|
523.2 Mb | AVP_000_005_95_N_P_AU_TRN_N_20220826.tif | The Upper-CI for Available phosphorus (mg/kg) at 0 to 0.05 metres |
 Click to enlarge the image
|
|
480 Mb | AVP_005_015_95_N_P_AU_TRN_N_20220826.tif | The Upper-CI for Available phosphorus (mg/kg) at 0.05 to 0.15 metres |
 Click to enlarge the image
|
|
296.3 Mb | AVP_015_030_95_N_P_AU_TRN_N_20220826.tif | The Upper-CI for Available phosphorus (mg/kg) at 0.15 to 0.3 metres |
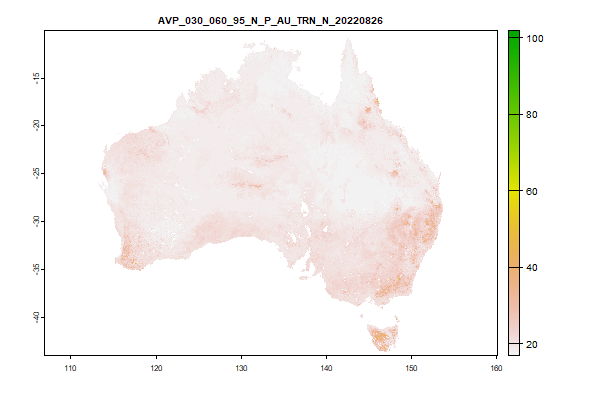 Click to enlarge the image
|
|
212.1 Mb | AVP_030_060_95_N_P_AU_TRN_N_20220826.tif | The Upper-CI for Available phosphorus (mg/kg) at 0.3 to 0.6 metres |
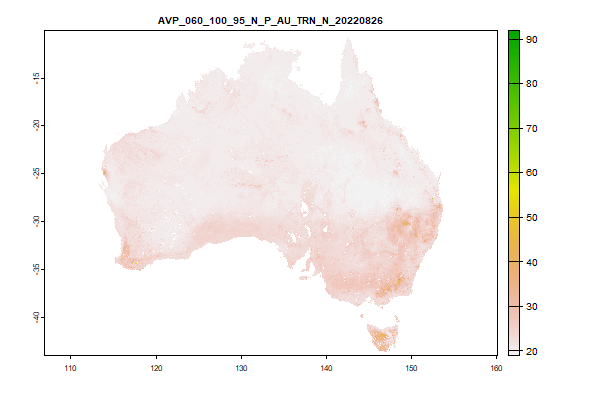 Click to enlarge the image
|
|
187.5 Mb | AVP_060_100_95_N_P_AU_TRN_N_20220826.tif | The Upper-CI for Available phosphorus (mg/kg) at 0.6 to 1 metres |
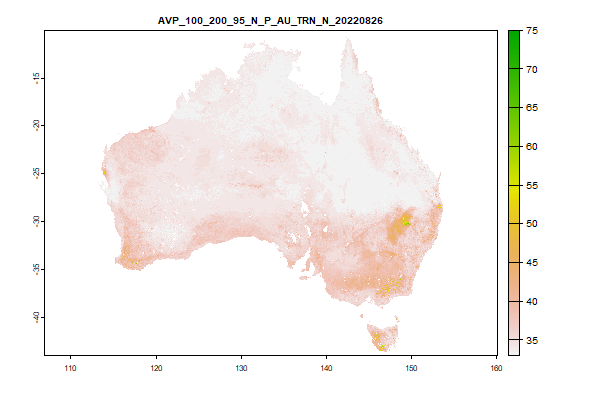 Click to enlarge the image
|
|
165.7 Mb | AVP_100_200_95_N_P_AU_TRN_N_20220826.tif | The Upper-CI for Available phosphorus (mg/kg) at 1 to 2 metres |
The URLs in this section are for the current version products of the 30m resolution products of the Soil and Landscape Grid
| Got to the web directory for this product | ||||
 Click to enlarge the image
|
|
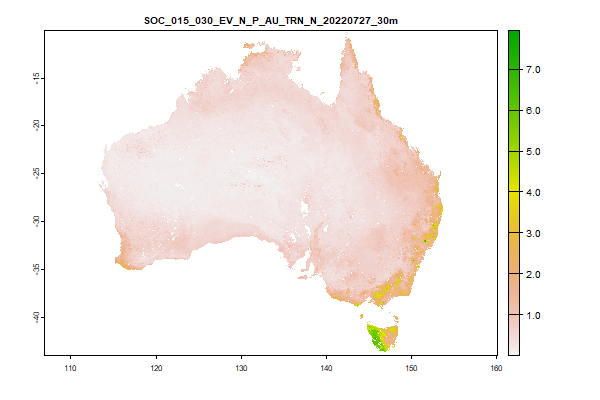
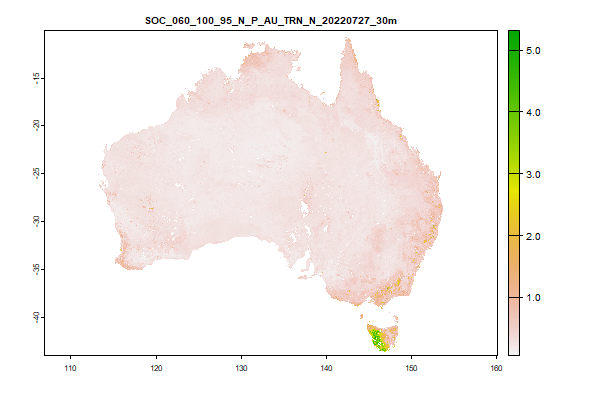
10.5 Gb | SOC_000_005_EV_N_P_AU_TRN_N_20220727_30m.tif | The Modelled-Value for Soil Organic Carbon (1" resolution) (%) at 0 to 0.05 metres |
 Click to enlarge the image
|
|
10.1 Gb | SOC_005_015_EV_N_P_AU_TRN_N_20220727_30m.tif | The Modelled-Value for Soil Organic Carbon (1" resolution) (%) at 0.05 to 0.15 metres |
 Click to enlarge the image
|
|
8 Gb | SOC_015_030_EV_N_P_AU_TRN_N_20220727_30m.tif | The Modelled-Value for Soil Organic Carbon (1" resolution) (%) at 0.15 to 0.3 metres |
 Click to enlarge the image
|
|
7.9 Gb | SOC_030_060_EV_N_P_AU_TRN_N_20220727_30m.tif | The Modelled-Value for Soil Organic Carbon (1" resolution) (%) at 0.3 to 0.6 metres |
 Click to enlarge the image
|
|
6.7 Gb | SOC_060_100_EV_N_P_AU_TRN_N_20220727_30m.tif | The Modelled-Value for Soil Organic Carbon (1" resolution) (%) at 0.6 to 1 metres |
 Click to enlarge the image
|
|
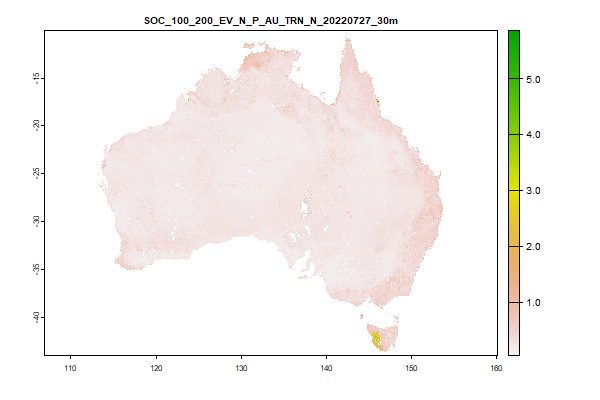
6.4 Gb | SOC_100_200_EV_N_P_AU_TRN_N_20220727_30m.tif | The Modelled-Value for Soil Organic Carbon (1" resolution) (%) at 1 to 2 metres |
 Click to enlarge the image
|
|
10.5 Gb | SOC_000_005_05_N_P_AU_TRN_N_20220727_30m.tif | The Lower-CI for Soil Organic Carbon (1" resolution) (%) at 0 to 0.05 metres |
 Click to enlarge the image
|
|
10.1 Gb | SOC_005_015_05_N_P_AU_TRN_N_20220727_30m.tif | The Lower-CI for Soil Organic Carbon (1" resolution) (%) at 0.05 to 0.15 metres |
 Click to enlarge the image
|
|
8 Gb | SOC_015_030_05_N_P_AU_TRN_N_20220727_30m.tif | The Lower-CI for Soil Organic Carbon (1" resolution) (%) at 0.15 to 0.3 metres |
 Click to enlarge the image
|
|
7.9 Gb | SOC_030_060_05_N_P_AU_TRN_N_20220727_30m.tif | The Lower-CI for Soil Organic Carbon (1" resolution) (%) at 0.3 to 0.6 metres |
 Click to enlarge the image
|
|
6.7 Gb | SOC_060_100_05_N_P_AU_TRN_N_20220727_30m.tif | The Lower-CI for Soil Organic Carbon (1" resolution) (%) at 0.6 to 1 metres |
 Click to enlarge the image
|
|
6.4 Gb | SOC_100_200_05_N_P_AU_TRN_N_20220727_30m.tif | The Lower-CI for Soil Organic Carbon (1" resolution) (%) at 1 to 2 metres |
 Click to enlarge the image
|
|
10.5 Gb | SOC_000_005_95_N_P_AU_TRN_N_20220727_30m.tif | The Upper-CI for Soil Organic Carbon (1" resolution) (%) at 0 to 0.05 metres |
 Click to enlarge the image
|
|
10.1 Gb | SOC_005_015_95_N_P_AU_TRN_N_20220727_30m.tif | The Upper-CI for Soil Organic Carbon (1" resolution) (%) at 0.05 to 0.15 metres |
 Click to enlarge the image
|
|
8 Gb | SOC_015_030_95_N_P_AU_TRN_N_20220727_30m.tif | The Upper-CI for Soil Organic Carbon (1" resolution) (%) at 0.15 to 0.3 metres |
 Click to enlarge the image
|
|
7.9 Gb | SOC_030_060_95_N_P_AU_TRN_N_20220727_30m.tif | The Upper-CI for Soil Organic Carbon (1" resolution) (%) at 0.3 to 0.6 metres |
 Click to enlarge the image
|
|
6.7 Gb | SOC_060_100_95_N_P_AU_TRN_N_20220727_30m.tif | The Upper-CI for Soil Organic Carbon (1" resolution) (%) at 0.6 to 1 metres |
 Click to enlarge the image
|
|
6.4 Gb | SOC_100_200_95_N_P_AU_TRN_N_20220727_30m.tif | The Upper-CI for Soil Organic Carbon (1" resolution) (%) at 1 to 2 metres |
The URLs in this section are for the Version 1 products of the 90m resolution products of the Soil and Landscape Grid. These products have been superceded by the products in the list above.ie a version 2 product has been produced for this soil attribute
| Got to the web directory for this product | ||||
 Click to enlarge the image
|
|
3.6 Gb | AWC_000_005_EV_N_P_AU_NAT_C_20140801.tif | The Modelled-Value for Available Water Capacity (%) at 0 to 0.05 metres |
 Click to enlarge the image
|
|
3.6 Gb | AWC_005_015_EV_N_P_AU_NAT_C_20140801.tif | The Modelled-Value for Available Water Capacity (%) at 0.05 to 0.15 metres |
 Click to enlarge the image
|
|
3.6 Gb | AWC_015_030_EV_N_P_AU_NAT_C_20140801.tif | The Modelled-Value for Available Water Capacity (%) at 0.15 to 0.3 metres |
 Click to enlarge the image
|
|
3.6 Gb | AWC_030_060_EV_N_P_AU_NAT_C_20140801.tif | The Modelled-Value for Available Water Capacity (%) at 0.3 to 0.6 metres |
 Click to enlarge the image
|
|
3.6 Gb | AWC_060_100_EV_N_P_AU_NAT_C_20140801.tif | The Modelled-Value for Available Water Capacity (%) at 0.6 to 1 metres |
 Click to enlarge the image
|
|
3.6 Gb | AWC_100_200_EV_N_P_AU_NAT_C_20140801.tif | The Modelled-Value for Available Water Capacity (%) at 1 to 2 metres |
 Click to enlarge the image
|
|
3.8 Gb | AWC_000_005_05_N_P_AU_NAT_C_20140801.tif | The Lower-CI for Available Water Capacity (%) at 0 to 0.05 metres |
 Click to enlarge the image
|
|
3.8 Gb | AWC_005_015_05_N_P_AU_NAT_C_20140801.tif | The Lower-CI for Available Water Capacity (%) at 0.05 to 0.15 metres |
 Click to enlarge the image
|
|
3.7 Gb | AWC_015_030_05_N_P_AU_NAT_C_20140801.tif | The Lower-CI for Available Water Capacity (%) at 0.15 to 0.3 metres |
 Click to enlarge the image
|
|
3.8 Gb | AWC_030_060_05_N_P_AU_NAT_C_20140801.tif | The Lower-CI for Available Water Capacity (%) at 0.3 to 0.6 metres |
 Click to enlarge the image
|
|
3.8 Gb | AWC_060_100_05_N_P_AU_NAT_C_20140801.tif | The Lower-CI for Available Water Capacity (%) at 0.6 to 1 metres |
 Click to enlarge the image
|
|
3.7 Gb | AWC_100_200_05_N_P_AU_NAT_C_20140801.tif | The Lower-CI for Available Water Capacity (%) at 1 to 2 metres |
 Click to enlarge the image
|
|
3.4 Gb | AWC_000_005_95_N_P_AU_NAT_C_20140801.tif | The Upper-CI for Available Water Capacity (%) at 0 to 0.05 metres |
 Click to enlarge the image
|
|
3.4 Gb | AWC_005_015_95_N_P_AU_NAT_C_20140801.tif | The Upper-CI for Available Water Capacity (%) at 0.05 to 0.15 metres |
 Click to enlarge the image
|
|
3.4 Gb | AWC_015_030_95_N_P_AU_NAT_C_20140801.tif | The Upper-CI for Available Water Capacity (%) at 0.15 to 0.3 metres |
 Click to enlarge the image
|
|
3.4 Gb | AWC_030_060_95_N_P_AU_NAT_C_20140801.tif | The Upper-CI for Available Water Capacity (%) at 0.3 to 0.6 metres |
 Click to enlarge the image
|
|
3.4 Gb | AWC_060_100_95_N_P_AU_NAT_C_20140801.tif | The Upper-CI for Available Water Capacity (%) at 0.6 to 1 metres |
 Click to enlarge the image
|
|
3.4 Gb | AWC_100_200_95_N_P_AU_NAT_C_20140801.tif | The Upper-CI for Available Water Capacity (%) at 1 to 2 metres |
| Got to the web directory for this product | ||||
 Click to enlarge the image
|
|
3.8 Gb | CLY_000_005_EV_N_P_AU_NAT_C_20140801.tif | The Modelled-Value for Clay (%) at 0 to 0.05 metres |
 Click to enlarge the image
|
|
3.8 Gb | CLY_005_015_EV_N_P_AU_NAT_C_20140801.tif | The Modelled-Value for Clay (%) at 0.05 to 0.15 metres |
 Click to enlarge the image
|
|
3.8 Gb | CLY_015_030_EV_N_P_AU_NAT_C_20140801.tif | The Modelled-Value for Clay (%) at 0.15 to 0.3 metres |
 Click to enlarge the image
|
|
3.8 Gb | CLY_030_060_EV_N_P_AU_NAT_C_20140801.tif | The Modelled-Value for Clay (%) at 0.3 to 0.6 metres |
 Click to enlarge the image
|
|
3.8 Gb | CLY_060_100_EV_N_P_AU_NAT_C_20140801.tif | The Modelled-Value for Clay (%) at 0.6 to 1 metres |
 Click to enlarge the image
|
|
3.8 Gb | CLY_100_200_EV_N_P_AU_NAT_C_20140801.tif | The Modelled-Value for Clay (%) at 1 to 2 metres |
 Click to enlarge the image
|
|
4.1 Gb | CLY_000_005_05_N_P_AU_NAT_C_20140801.tif | The Lower-CI for Clay (%) at 0 to 0.05 metres |
 Click to enlarge the image
|
|
4.1 Gb | CLY_005_015_05_N_P_AU_NAT_C_20140801.tif | The Lower-CI for Clay (%) at 0.05 to 0.15 metres |
 Click to enlarge the image
|
|
4 Gb | CLY_015_030_05_N_P_AU_NAT_C_20140801.tif | The Lower-CI for Clay (%) at 0.15 to 0.3 metres |
 Click to enlarge the image
|
|
4 Gb | CLY_030_060_05_N_P_AU_NAT_C_20140801.tif | The Lower-CI for Clay (%) at 0.3 to 0.6 metres |
 Click to enlarge the image
|
|
3.9 Gb | CLY_060_100_05_N_P_AU_NAT_C_20140801.tif | The Lower-CI for Clay (%) at 0.6 to 1 metres |
 Click to enlarge the image
|
|
3.9 Gb | CLY_100_200_05_N_P_AU_NAT_C_20140801.tif | The Lower-CI for Clay (%) at 1 to 2 metres |
 Click to enlarge the image
|
|
3.8 Gb | CLY_000_005_95_N_P_AU_NAT_C_20140801.tif | The Upper-CI for Clay (%) at 0 to 0.05 metres |
 Click to enlarge the image
|
|
3.8 Gb | CLY_005_015_95_N_P_AU_NAT_C_20140801.tif | The Upper-CI for Clay (%) at 0.05 to 0.15 metres |
 Click to enlarge the image
|
|
3.8 Gb | CLY_015_030_95_N_P_AU_NAT_C_20140801.tif | The Upper-CI for Clay (%) at 0.15 to 0.3 metres |
 Click to enlarge the image
|
|
3.7 Gb | CLY_030_060_95_N_P_AU_NAT_C_20140801.tif | The Upper-CI for Clay (%) at 0.3 to 0.6 metres |
 Click to enlarge the image
|
|
3.7 Gb | CLY_060_100_95_N_P_AU_NAT_C_20140801.tif | The Upper-CI for Clay (%) at 0.6 to 1 metres |
 Click to enlarge the image
|
|
3.7 Gb | CLY_100_200_95_N_P_AU_NAT_C_20140801.tif | The Upper-CI for Clay (%) at 1 to 2 metres |
| Got to the web directory for this product | ||||
 Click to enlarge the image
|
|
3.6 Gb | DES_000_200_EV_N_P_AU_NAT_C_20140801.tif | The Modelled-Value for Depth of Soil (m) at 0 to 2 metres |
 Click to enlarge the image
|
|
3.7 Gb | DES_000_200_05_N_P_AU_NAT_C_20140801.tif | The Lower-CI for Depth of Soil (m) at 0 to 2 metres |
 Click to enlarge the image
|
|
3.6 Gb | DES_000_200_95_N_P_AU_NAT_C_20140801.tif | The Upper-CI for Depth of Soil (m) at 0 to 2 metres |
| Got to the web directory for this product | ||||
 Click to enlarge the image
|
|
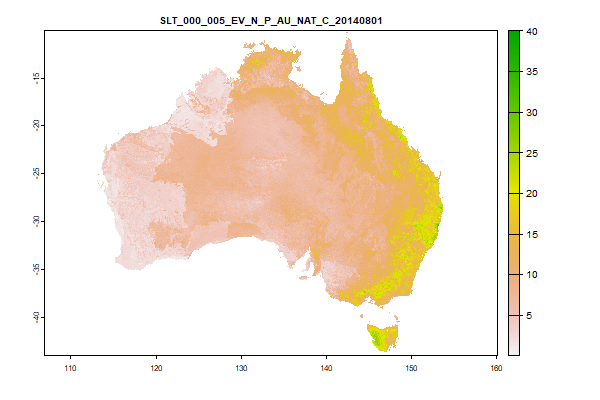
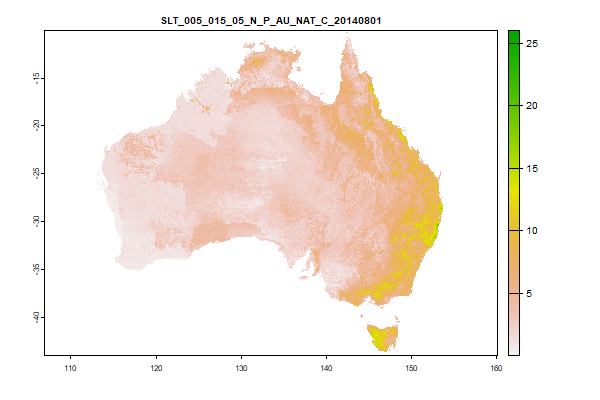
3.8 Gb | SLT_000_005_EV_N_P_AU_NAT_C_20140801.tif | The Modelled-Value for Silt (%) at 0 to 0.05 metres |
 Click to enlarge the image
|
|
3.8 Gb | SLT_005_015_EV_N_P_AU_NAT_C_20140801.tif | The Modelled-Value for Silt (%) at 0.05 to 0.15 metres |
 Click to enlarge the image
|
|
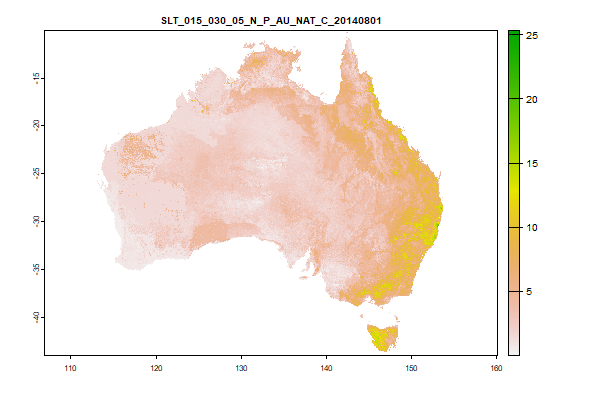
3.8 Gb | SLT_015_030_EV_N_P_AU_NAT_C_20140801.tif | The Modelled-Value for Silt (%) at 0.15 to 0.3 metres |
 Click to enlarge the image
|
|
3.7 Gb | SLT_030_060_EV_N_P_AU_NAT_C_20140801.tif | The Modelled-Value for Silt (%) at 0.3 to 0.6 metres |
 Click to enlarge the image
|
|
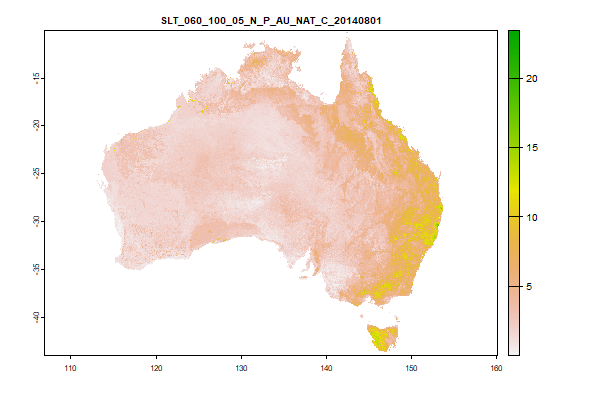
3.8 Gb | SLT_060_100_EV_N_P_AU_NAT_C_20140801.tif | The Modelled-Value for Silt (%) at 0.6 to 1 metres |
 Click to enlarge the image
|
|
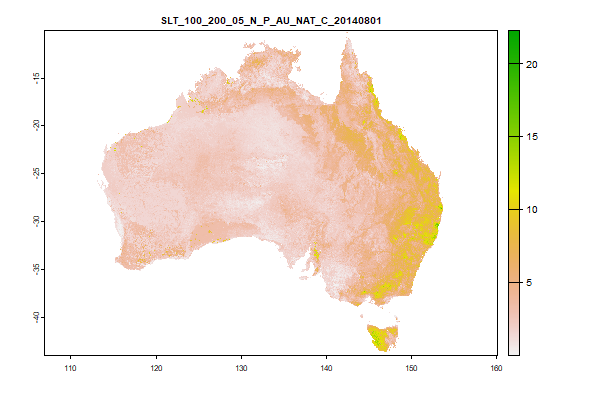
3.8 Gb | SLT_100_200_EV_N_P_AU_NAT_C_20140801.tif | The Modelled-Value for Silt (%) at 1 to 2 metres |
 Click to enlarge the image
|
|
3.8 Gb | SLT_000_005_05_N_P_AU_NAT_C_20140801.tif | The Lower-CI for Silt (%) at 0 to 0.05 metres |
 Click to enlarge the image
|
|
3.8 Gb | SLT_005_015_05_N_P_AU_NAT_C_20140801.tif | The Lower-CI for Silt (%) at 0.05 to 0.15 metres |
 Click to enlarge the image
|
|
3.8 Gb | SLT_015_030_05_N_P_AU_NAT_C_20140801.tif | The Lower-CI for Silt (%) at 0.15 to 0.3 metres |
 Click to enlarge the image
|
|
3.8 Gb | SLT_030_060_05_N_P_AU_NAT_C_20140801.tif | The Lower-CI for Silt (%) at 0.3 to 0.6 metres |
 Click to enlarge the image
|
|
3.8 Gb | SLT_060_100_05_N_P_AU_NAT_C_20140801.tif | The Lower-CI for Silt (%) at 0.6 to 1 metres |
 Click to enlarge the image
|
|
3.8 Gb | SLT_100_200_05_N_P_AU_NAT_C_20140801.tif | The Lower-CI for Silt (%) at 1 to 2 metres |
 Click to enlarge the image
|
|
3.7 Gb | SLT_000_005_95_N_P_AU_NAT_C_20140801.tif | The Upper-CI for Silt (%) at 0 to 0.05 metres |
 Click to enlarge the image
|
|
3.7 Gb | SLT_005_015_95_N_P_AU_NAT_C_20140801.tif | The Upper-CI for Silt (%) at 0.05 to 0.15 metres |
 Click to enlarge the image
|
|
3.7 Gb | SLT_015_030_95_N_P_AU_NAT_C_20140801.tif | The Upper-CI for Silt (%) at 0.15 to 0.3 metres |
 Click to enlarge the image
|
|
3.7 Gb | SLT_030_060_95_N_P_AU_NAT_C_20140801.tif | The Upper-CI for Silt (%) at 0.3 to 0.6 metres |
 Click to enlarge the image
|
|
3.7 Gb | SLT_060_100_95_N_P_AU_NAT_C_20140801.tif | The Upper-CI for Silt (%) at 0.6 to 1 metres |
 Click to enlarge the image
|
|
3.7 Gb | SLT_100_200_95_N_P_AU_NAT_C_20140801.tif | The Upper-CI for Silt (%) at 1 to 2 metres |
| Got to the web directory for this product | ||||
 Click to enlarge the image
|
|
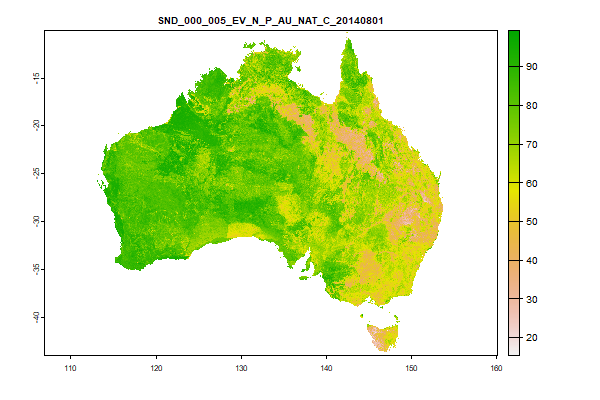
3.6 Gb | SND_000_005_EV_N_P_AU_NAT_C_20140801.tif | The Modelled-Value for Sand (%) at 0 to 0.05 metres |
 Click to enlarge the image
|
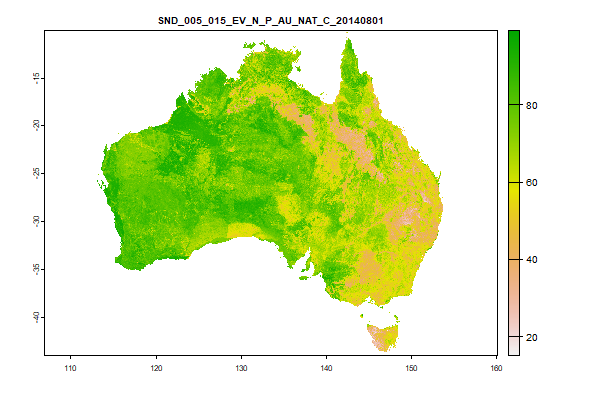
|
3.6 Gb | SND_005_015_EV_N_P_AU_NAT_C_20140801.tif | The Modelled-Value for Sand (%) at 0.05 to 0.15 metres |
 Click to enlarge the image
|
|
3.6 Gb | SND_015_030_EV_N_P_AU_NAT_C_20140801.tif | The Modelled-Value for Sand (%) at 0.15 to 0.3 metres |
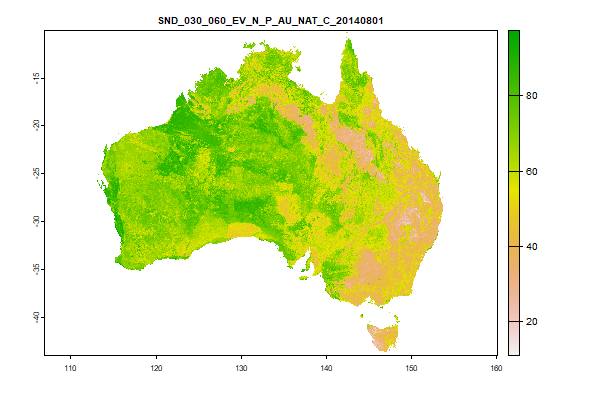 Click to enlarge the image
|
|
3.6 Gb | SND_030_060_EV_N_P_AU_NAT_C_20140801.tif | The Modelled-Value for Sand (%) at 0.3 to 0.6 metres |
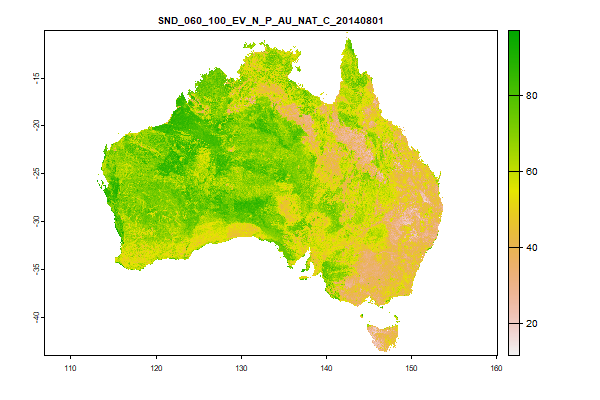 Click to enlarge the image
|
|
3.7 Gb | SND_060_100_EV_N_P_AU_NAT_C_20140801.tif | The Modelled-Value for Sand (%) at 0.6 to 1 metres |
 Click to enlarge the image
|
|
3.7 Gb | SND_100_200_EV_N_P_AU_NAT_C_20140801.tif | The Modelled-Value for Sand (%) at 1 to 2 metres |
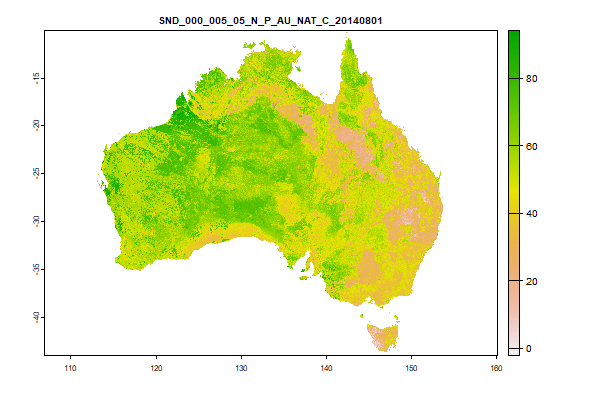 Click to enlarge the image
|
|
3.7 Gb | SND_000_005_05_N_P_AU_NAT_C_20140801.tif | The Lower-CI for Sand (%) at 0 to 0.05 metres |
 Click to enlarge the image
|
|
3.7 Gb | SND_005_015_05_N_P_AU_NAT_C_20140801.tif | The Lower-CI for Sand (%) at 0.05 to 0.15 metres |
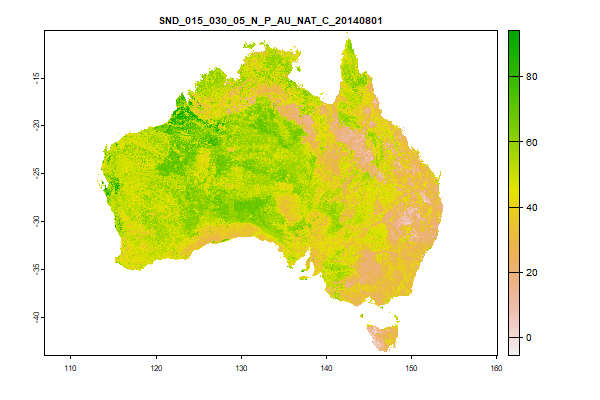 Click to enlarge the image
|
|
3.7 Gb | SND_015_030_05_N_P_AU_NAT_C_20140801.tif | The Lower-CI for Sand (%) at 0.15 to 0.3 metres |
 Click to enlarge the image
|
|
3.8 Gb | SND_030_060_05_N_P_AU_NAT_C_20140801.tif | The Lower-CI for Sand (%) at 0.3 to 0.6 metres |
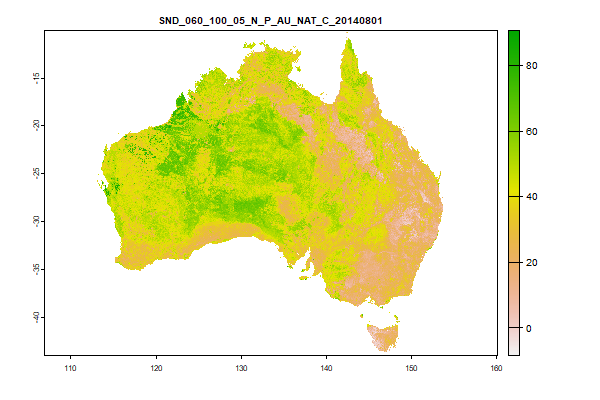 Click to enlarge the image
|
|
3.8 Gb | SND_060_100_05_N_P_AU_NAT_C_20140801.tif | The Lower-CI for Sand (%) at 0.6 to 1 metres |
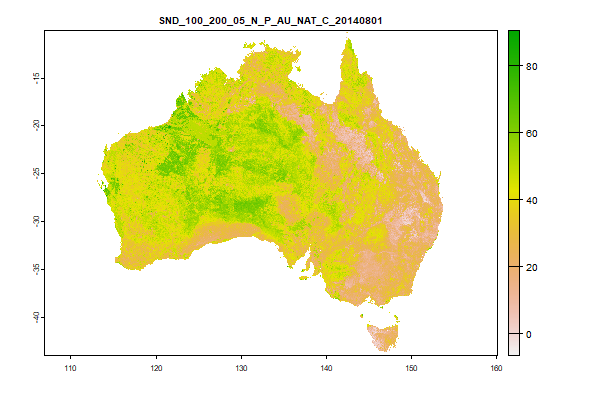 Click to enlarge the image
|
|
3.8 Gb | SND_100_200_05_N_P_AU_NAT_C_20140801.tif | The Lower-CI for Sand (%) at 1 to 2 metres |
 Click to enlarge the image
|
|
3.6 Gb | SND_000_005_95_N_P_AU_NAT_C_20140801.tif | The Upper-CI for Sand (%) at 0 to 0.05 metres |
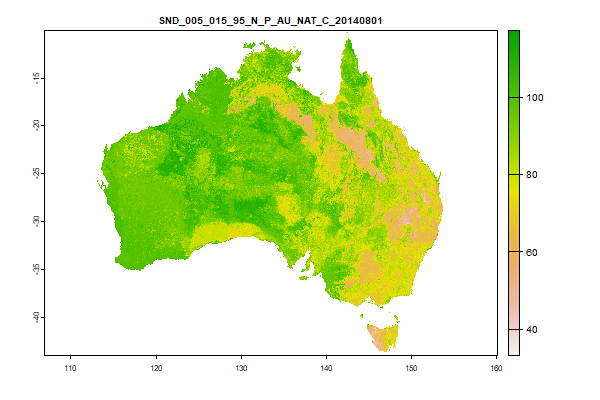 Click to enlarge the image
|
|
3.6 Gb | SND_005_015_95_N_P_AU_NAT_C_20140801.tif | The Upper-CI for Sand (%) at 0.05 to 0.15 metres |
 Click to enlarge the image
|
|
3.6 Gb | SND_015_030_95_N_P_AU_NAT_C_20140801.tif | The Upper-CI for Sand (%) at 0.15 to 0.3 metres |
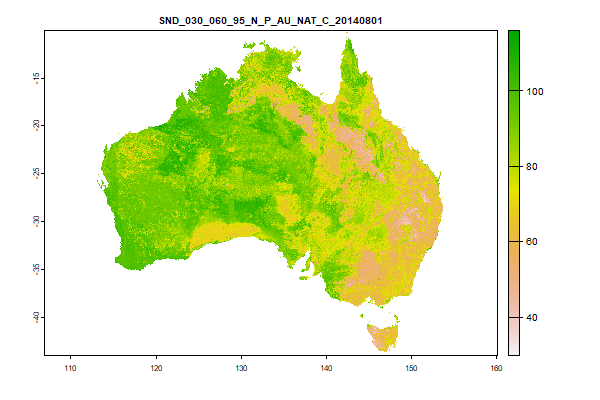 Click to enlarge the image
|
|
3.6 Gb | SND_030_060_95_N_P_AU_NAT_C_20140801.tif | The Upper-CI for Sand (%) at 0.3 to 0.6 metres |
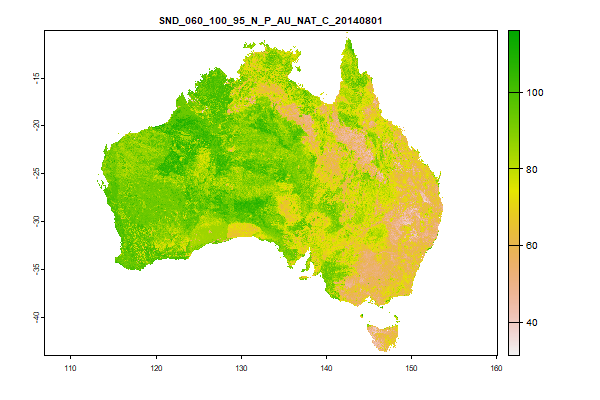 Click to enlarge the image
|
|
3.6 Gb | SND_060_100_95_N_P_AU_NAT_C_20140801.tif | The Upper-CI for Sand (%) at 0.6 to 1 metres |
 Click to enlarge the image
|
|
3.6 Gb | SND_100_200_95_N_P_AU_NAT_C_20140801.tif | The Upper-CI for Sand (%) at 1 to 2 metres |
| Got to the web directory for this product | ||||
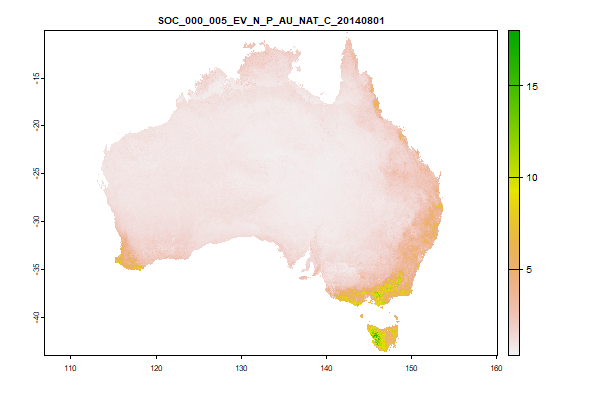 Click to enlarge the image
|
|
3.7 Gb | SOC_000_005_EV_N_P_AU_NAT_C_20140801.tif | The Modelled-Value for Organic Carbon (%) at 0 to 0.05 metres |
 Click to enlarge the image
|
|
3.7 Gb | SOC_005_015_EV_N_P_AU_NAT_C_20140801.tif | The Modelled-Value for Organic Carbon (%) at 0.05 to 0.15 metres |
 Click to enlarge the image
|
|
3.8 Gb | SOC_015_030_EV_N_P_AU_NAT_C_20140801.tif | The Modelled-Value for Organic Carbon (%) at 0.15 to 0.3 metres |
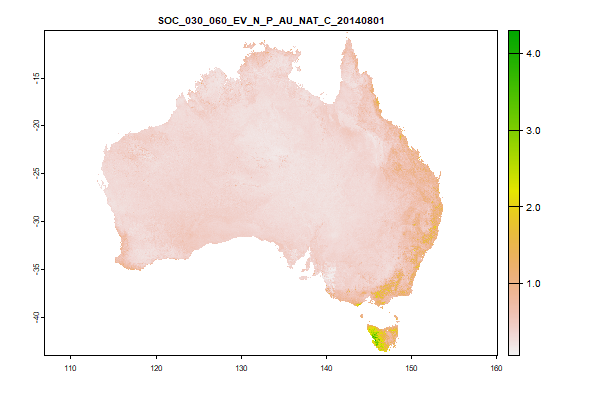 Click to enlarge the image
|
|
3.7 Gb | SOC_030_060_EV_N_P_AU_NAT_C_20140801.tif | The Modelled-Value for Organic Carbon (%) at 0.3 to 0.6 metres |
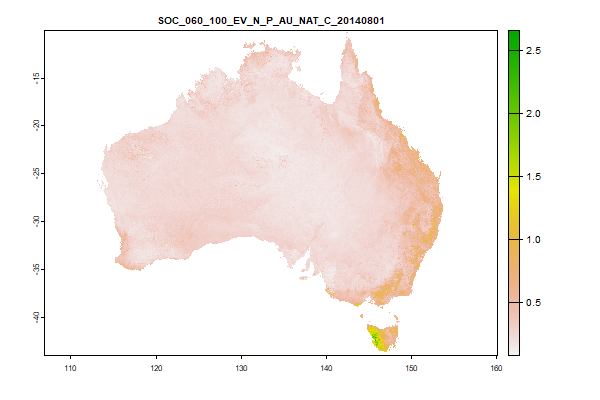 Click to enlarge the image
|
|
3.7 Gb | SOC_060_100_EV_N_P_AU_NAT_C_20140801.tif | The Modelled-Value for Organic Carbon (%) at 0.6 to 1 metres |
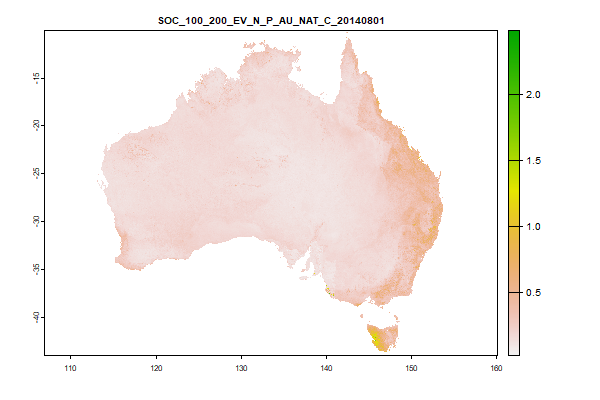 Click to enlarge the image
|
|
3.8 Gb | SOC_100_200_EV_N_P_AU_NAT_C_20140801.tif | The Modelled-Value for Organic Carbon (%) at 1 to 2 metres |
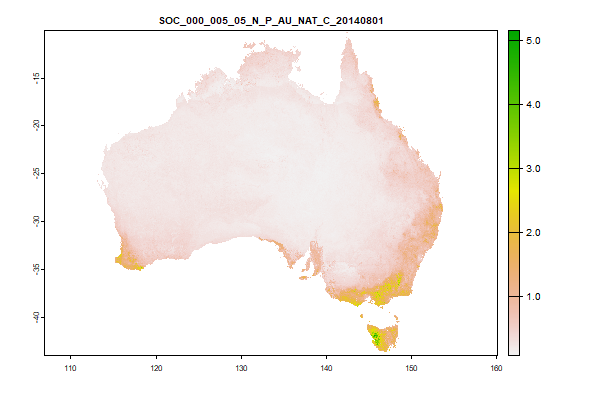 Click to enlarge the image
|
|
3.7 Gb | SOC_000_005_05_N_P_AU_NAT_C_20140801.tif | The Lower-CI for Organic Carbon (%) at 0 to 0.05 metres |
 Click to enlarge the image
|
|
3.7 Gb | SOC_005_015_05_N_P_AU_NAT_C_20140801.tif | The Lower-CI for Organic Carbon (%) at 0.05 to 0.15 metres |
 Click to enlarge the image
|
|
3.8 Gb | SOC_015_030_05_N_P_AU_NAT_C_20140801.tif | The Lower-CI for Organic Carbon (%) at 0.15 to 0.3 metres |
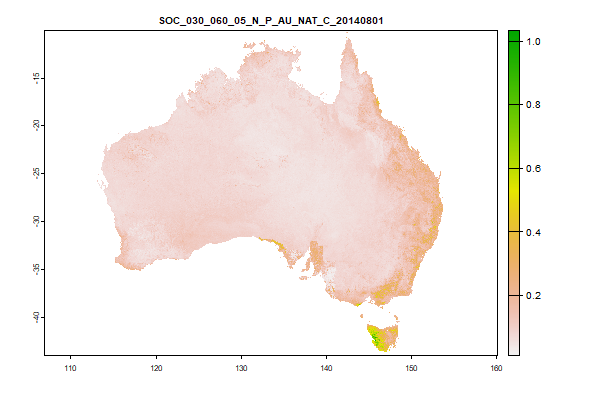 Click to enlarge the image
|
|
3.7 Gb | SOC_030_060_05_N_P_AU_NAT_C_20140801.tif | The Lower-CI for Organic Carbon (%) at 0.3 to 0.6 metres |
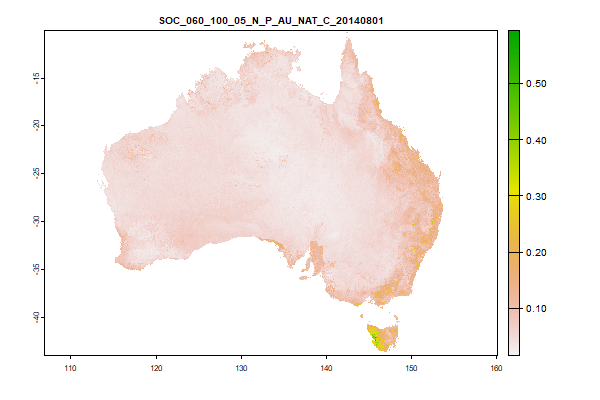 Click to enlarge the image
|
|
3.8 Gb | SOC_060_100_05_N_P_AU_NAT_C_20140801.tif | The Lower-CI for Organic Carbon (%) at 0.6 to 1 metres |
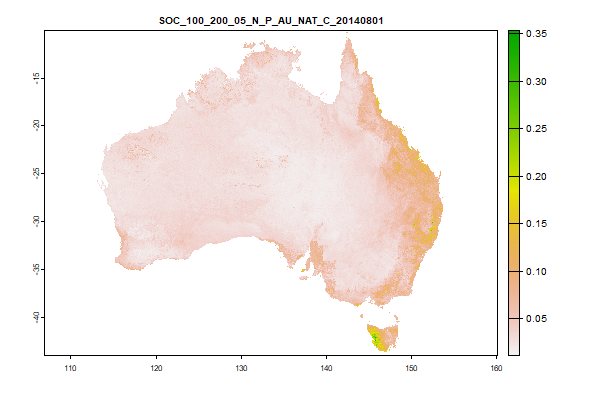 Click to enlarge the image
|
|
3.8 Gb | SOC_100_200_05_N_P_AU_NAT_C_20140801.tif | The Lower-CI for Organic Carbon (%) at 1 to 2 metres |
 Click to enlarge the image
|
|
3.8 Gb | SOC_000_005_95_N_P_AU_NAT_C_20140801.tif | The Upper-CI for Organic Carbon (%) at 0 to 0.05 metres |
 Click to enlarge the image
|
|
3.8 Gb | SOC_005_015_95_N_P_AU_NAT_C_20140801.tif | The Upper-CI for Organic Carbon (%) at 0.05 to 0.15 metres |
 Click to enlarge the image
|
|
3.8 Gb | SOC_015_030_95_N_P_AU_NAT_C_20140801.tif | The Upper-CI for Organic Carbon (%) at 0.15 to 0.3 metres |
 Click to enlarge the image
|
|
3.8 Gb | SOC_030_060_95_N_P_AU_NAT_C_20140801.tif | The Upper-CI for Organic Carbon (%) at 0.3 to 0.6 metres |
 Click to enlarge the image
|
|
3.7 Gb | SOC_060_100_95_N_P_AU_NAT_C_20140801.tif | The Upper-CI for Organic Carbon (%) at 0.6 to 1 metres |
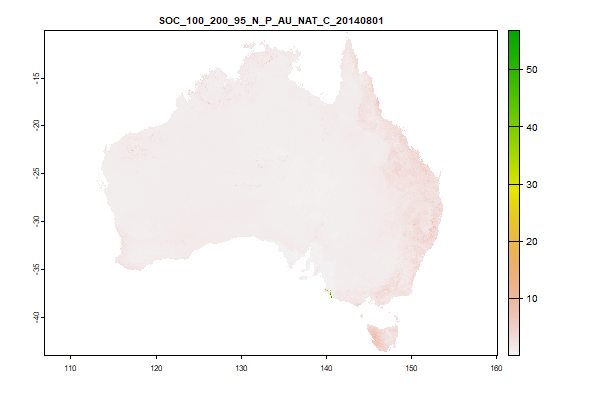 Click to enlarge the image
|
|
3.8 Gb | SOC_100_200_95_N_P_AU_NAT_C_20140801.tif | The Upper-CI for Organic Carbon (%) at 1 to 2 metres |
FundersPartners


TERN is enabled by NCRIS.